
Introduction – Hailey Draper
Historically Turkey, due to its unique location as a part of both the continents of Asia and Europe, has acted as both a barrier and bridge between these two continents. This region is very mountainous and is located between the Balkans, Caucasus, Middle East, and eastern Mediterranean with the Black Sea to the north and the Mediterranean Sea to the Southwest.
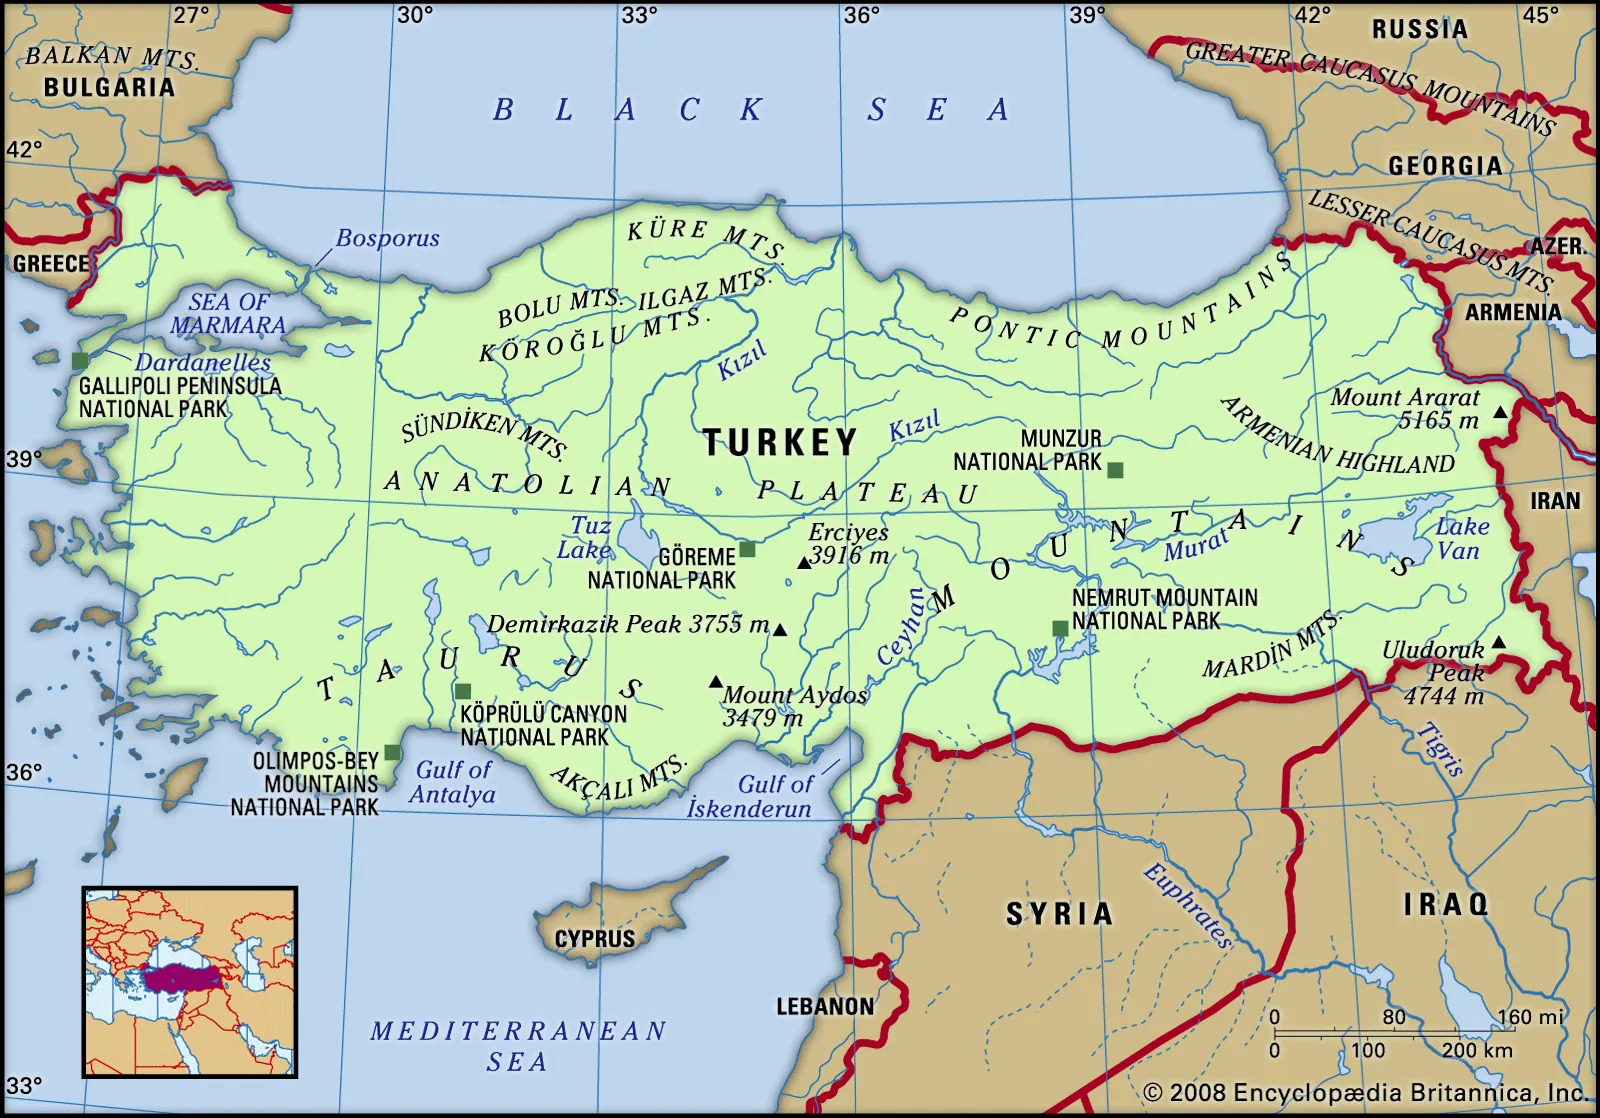
The religious composition of Turkey is majority Muslim with Sunnī Muslim as the predominant sect.
The information and images from this Introduction section can be found on this website.
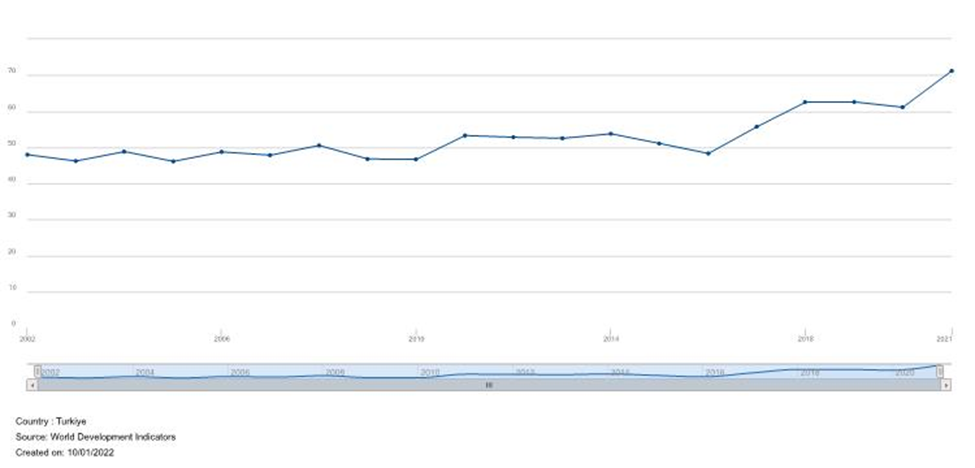
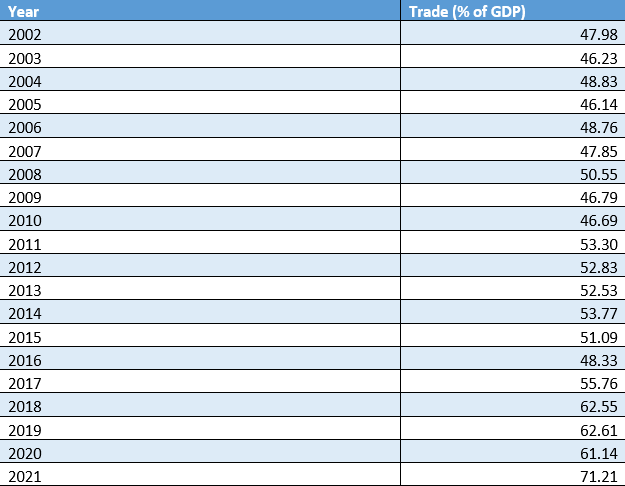
Trade – Sophie Chickering
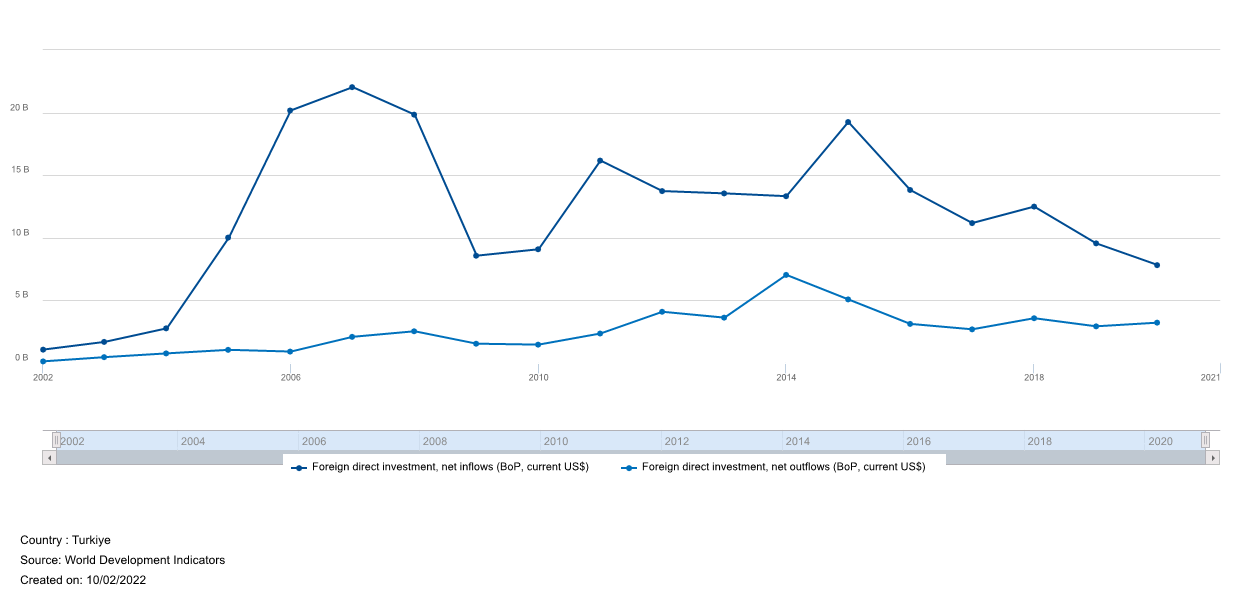
Foreign Direct Investment (FDI) Inflows and Outflows – Hailey Draper
Foreign direct investments are the direct investment equity flows (either inflows or outflows) in an economy. Direct investment is a type of cross-border investment that is associated with a resident in one economy having control or a significant degree of influence on the management of an enterprise that is resident in another economy. This is determined through ownership of 10 percent or more of the ordinary shares of voting stocks.
| Table 1: Time | FDI inflows (% of GDP) | FDI outflows (% of GDP) | FDI inflows (BoP, current US$) | FDI outflows (BoP, current US$) |
| 2002 | 0.450358 | 0.059521 | 1.08E+09 | 1.43E+08 |
| 2003 | 0.541017 | 0.152578 | 1.7E+09 | 4.8E+08 |
| 2004 | 0.681136 | 0.190767 | 2.79E+09 | 7.8E+08 |
| 2005 | 1.981204 | 0.210149 | 1E+10 | 1.06E+09 |
| 2006 | 3.623502 | 0.165871 | 2.02E+10 | 9.24E+08 |
| 2007 | 3.235842 | 0.309098 | 2.2E+10 | 2.11E+09 |
| 2008 | 2.576506 | 0.33084 | 1.99E+10 | 2.55E+09 |
| 2009 | 1.322249 | 0.239191 | 8.59E+09 | 1.55E+09 |
| 2010 | 1.171054 | 0.190735 | 9.1E+09 | 1.48E+09 |
| 2011 | 1.92927 | 0.282559 | 1.62E+10 | 2.37E+09 |
| 2012 | 1.560831 | 0.466296 | 1.37E+10 | 4.11E+09 |
| 2013 | 1.416083 | 0.379627 | 1.36E+10 | 3.64E+09 |
| 2014 | 1.420412 | 0.750837 | 1.33E+10 | 7.05E+09 |
| 2015 | 2.228697 | 0.589599 | 1.93E+10 | 5.1E+09 |
| 2016 | 1.590791 | 0.360817 | 1.38E+10 | 3.14E+09 |
| 2017 | 1.302683 | 0.31467 | 1.12E+10 | 2.7E+09 |
| 2018 | 1.606352 | 0.46116 | 1.25E+10 | 3.59E+09 |
| 2019 | 1.257943 | 0.386989 | 9.57E+09 | 2.95E+09 |
| 2020 | 1.087707 | 0.449889 | 7.83E+09 | 3.24E+09 |
| 2021 | .. | .. | .. | .. |
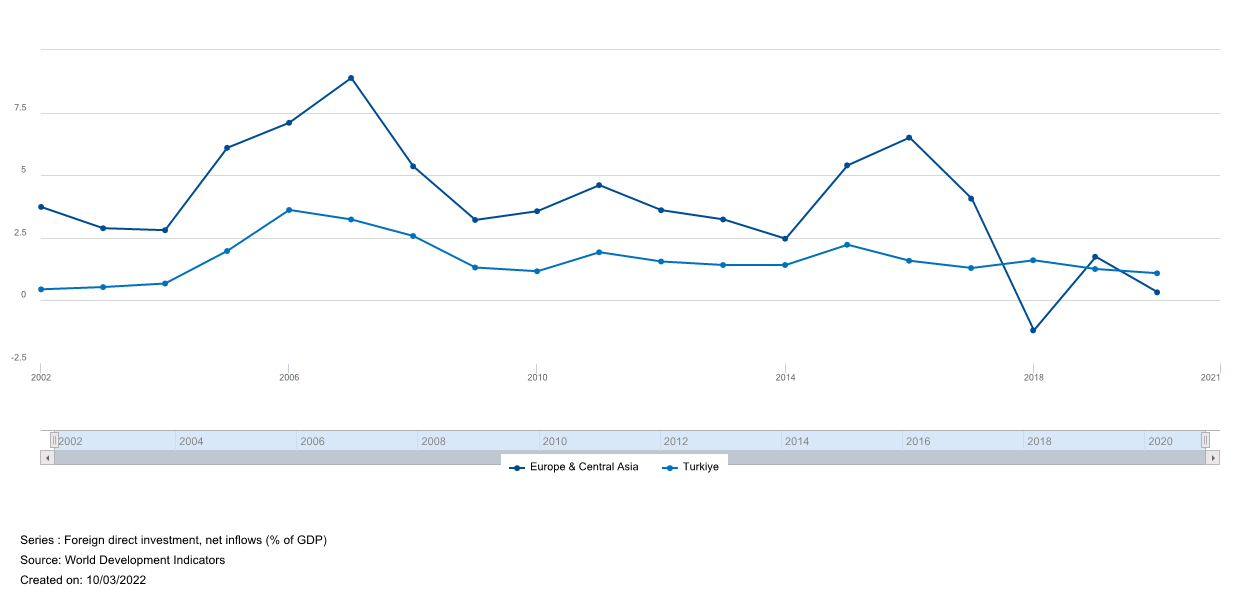
As shown in Figure 1, from 2002 to 2008 there was an increase in FDI net inflows. Following the Great Recession in 2008 FDI net inflows in Turkey decreased. They have been relatively constant since but haven’t reached the previous heights reached in 2007. While Turkey’s FDI net inflows have consistently been higher than their FDI net outflows for the past 20 years, FDI outflows did briefly increase in 2014 which was followed by a decrease to the previous levels.
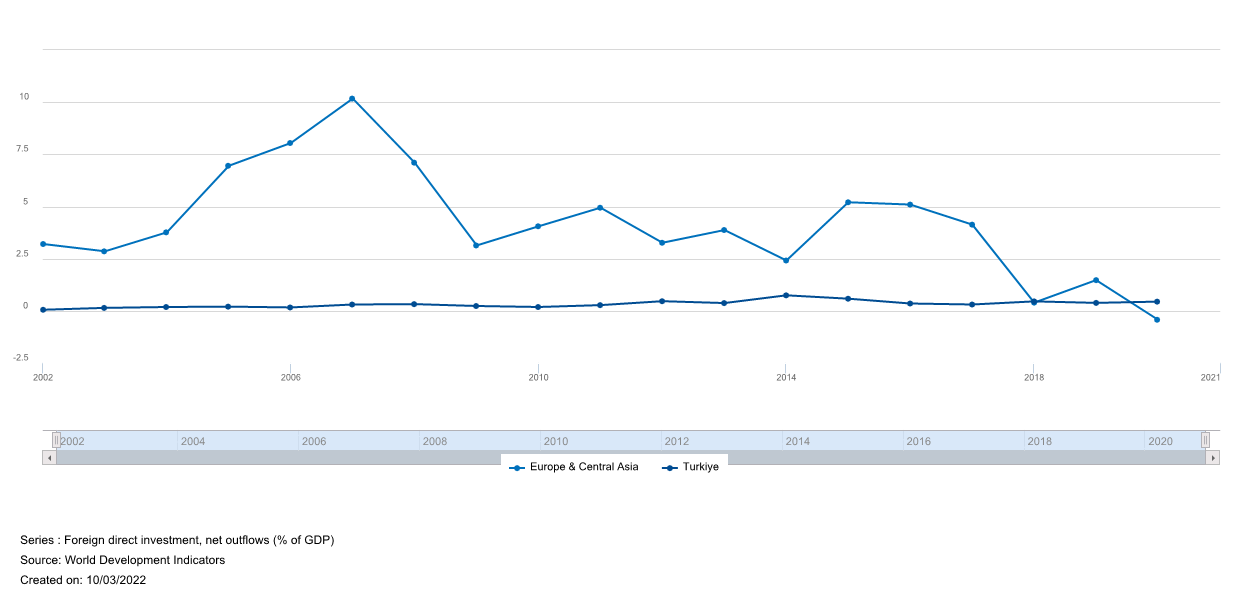
When compared to the region of Europe and Central Asia, Turkey’s inflows seem to mirror the patterns of the greater region (Figure 2). So Turkey’s net FDI inflows are proportional to its region, while their outflows seem to have no correlation to those of Europe and Central Asia and as previously mentioned seem to remain constant (Figure 3). Thus there is a lot of external investment, funding, and control in Turkey, but Turkey doesn’t exert that external power on other countries. The specific data points for the inflows and outflows of each year are listed in Graph 1 with both ways to quantify FDI (% of GDP/BoP current USD).
Attitudes toward Globalization – Sophie Chickering
Question: What do you think about the growing trade and business ties between Turkey and other countries – do you think it is a very good thing, somewhat good, somewhat bad or a very bad thing for our country?
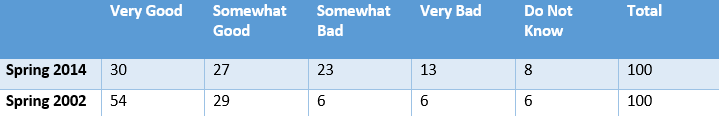
Question: In your opinion, when foreign companies buy Turkish companies, does this have a very good, somewhat good, somewhat bad, or a very bad impact on our country?

Question: In your opinion, when foreign companies build new factories in Turkey, does this have a very good, somewhat good, somewhat bad, or a very bad impact on our country?

Internet Access – Clare Kuczo
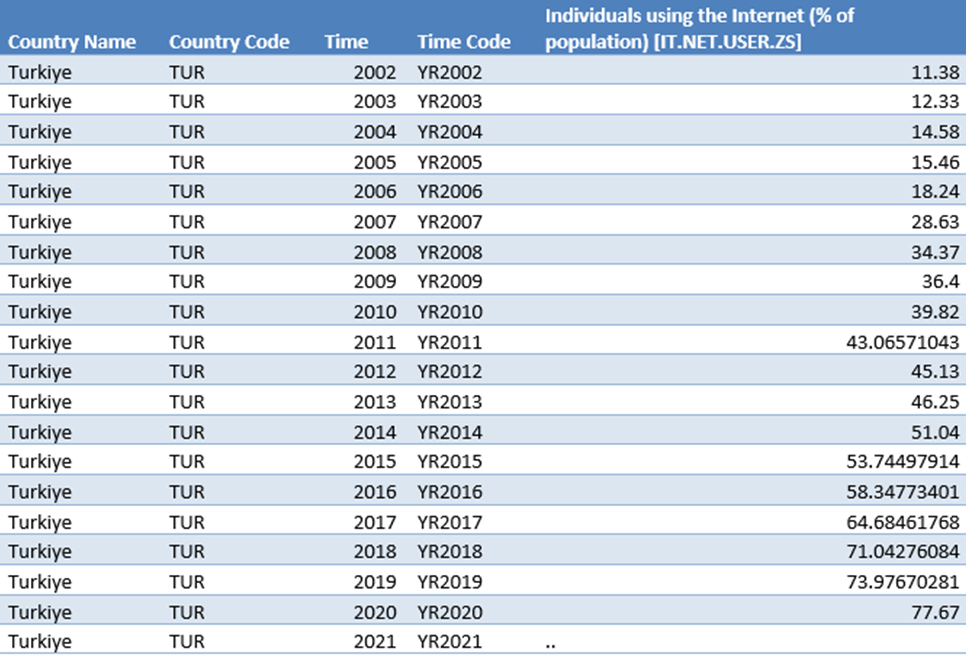
The table shows the internet access in Turkey for the past 20 years (2002-2021). Looking at the table you can see the percent of the population using the internet has significantly increased. It started at 11.8% in 2001 and in 2020 it was all the way up to 77.67%.
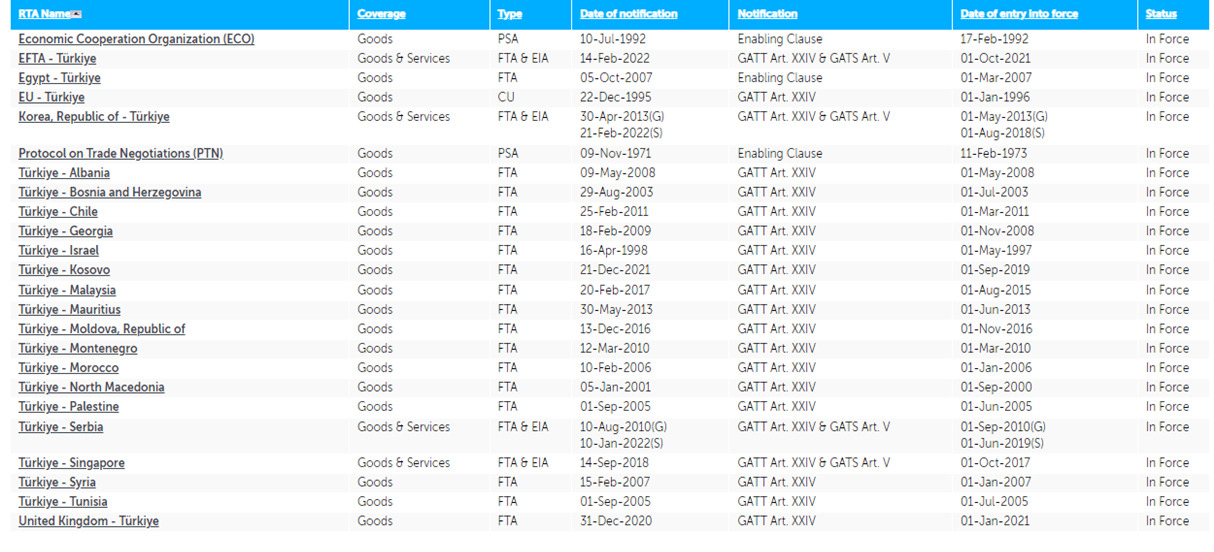
Participation in International Agreements – Clare Kuczo
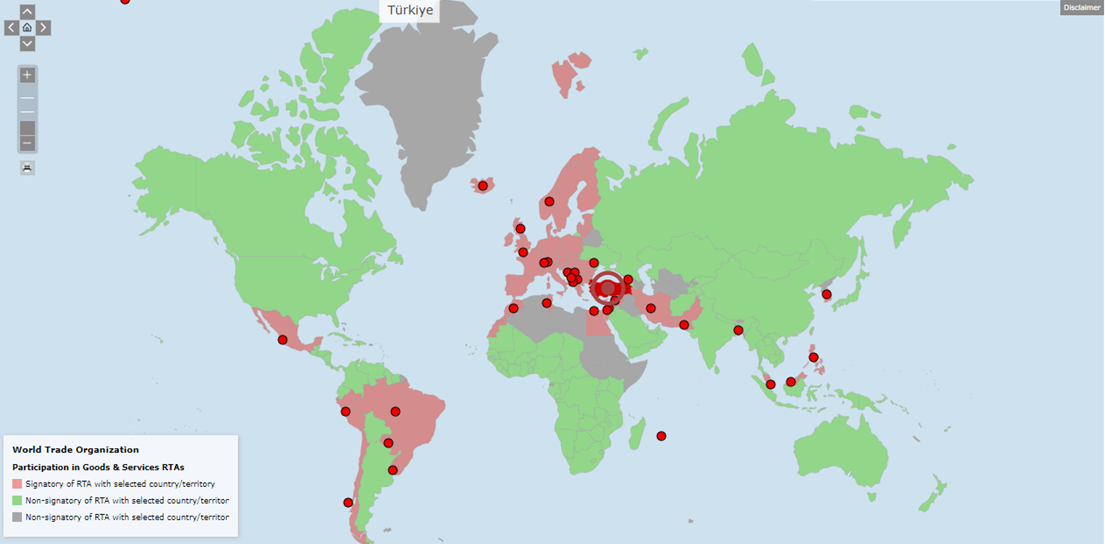
This map depicts the countries that have trade agreements with the country of Turkey.

Tourism – Ryan Tucker
Question 1: In your opinion, how much does tourism contribute to Turkey’s economy?

The volume of freight, express and diplomatic bags carried on each flight stage (operation of an aircraft from takeoff to its next land off), is measured in metric tons times kilometers traveled.
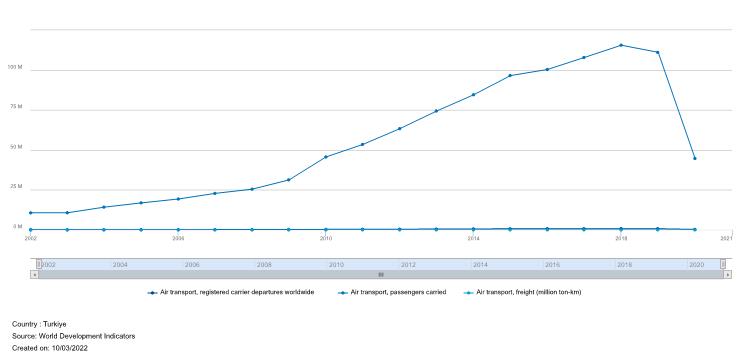
Figure 2: Represents air transport, by registered carrier departures worldwide. Which are domestic takeoffs and takeoffs abroad of air carriers registered in the country.

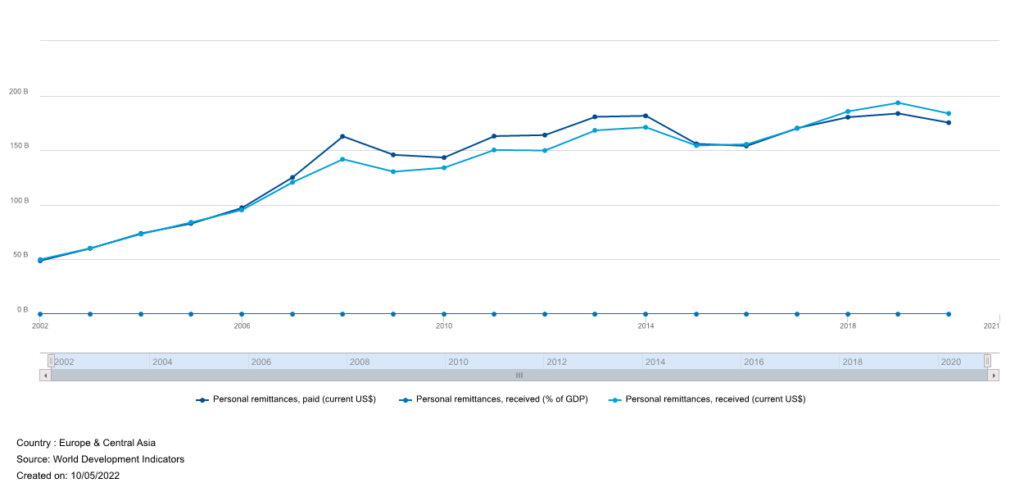
Personal remittances comprise personal transfers and compensation of employees. Personal transfers consist of all current transfers in cash or in kind made or received by resident households to or from nonresident households. Personal transfers thus include all current transfers between resident and nonresident individuals. Compensation of employees refers to the income of border, seasonal, and other short-term workers who are employed in an economy where they are not residents and of residents employed by nonresident entities.
Immigration and Emigration – Ryan Tucker
Question 1: What economic and political instabilities do you think pose a challenge for Turkish Immigration?
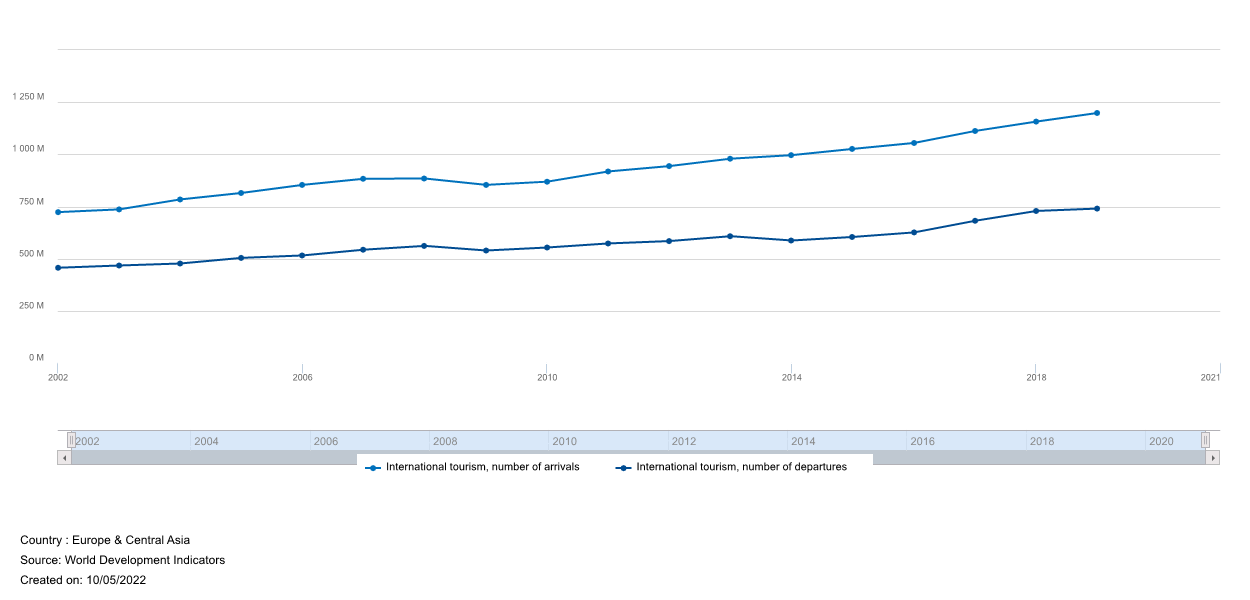
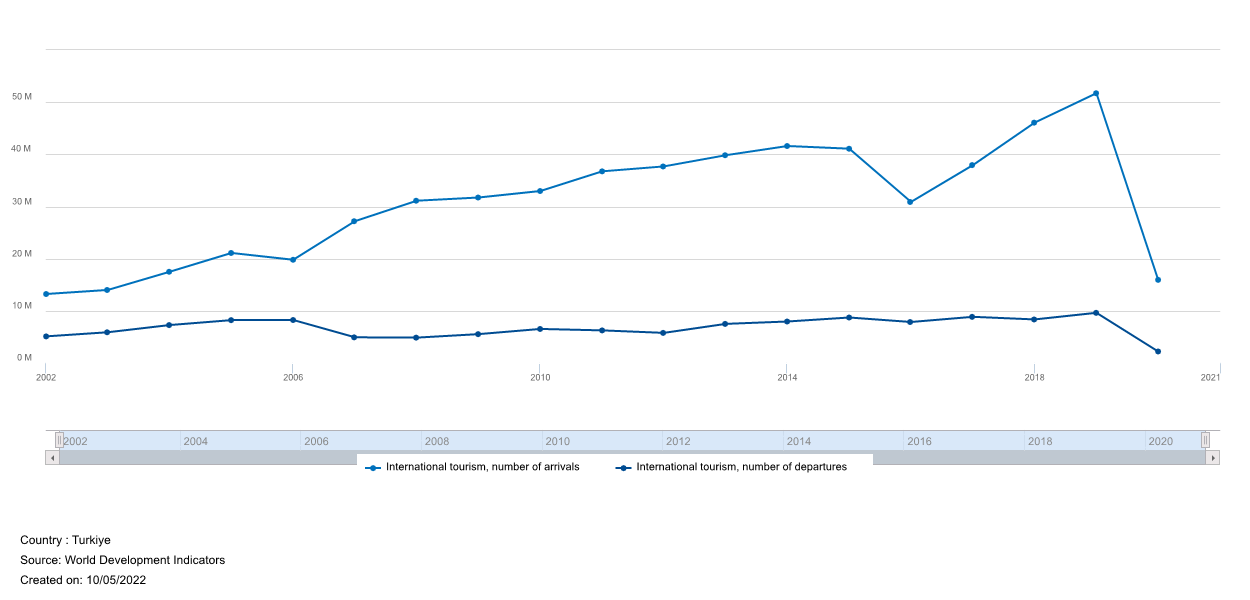
International inbound tourists (overnight visitors) are the number of tourists who travel to a country other than that in which they usually reside, and outside their usual environment, for a period not exceeding 12 months and whose main purpose in visiting is other than an activity remunerated from within the country visited. On the other hand, international outbound tourists are the number of departures that people make from their country of usual residence to any other country for any purpose other than an activity remunerated in the country visited.
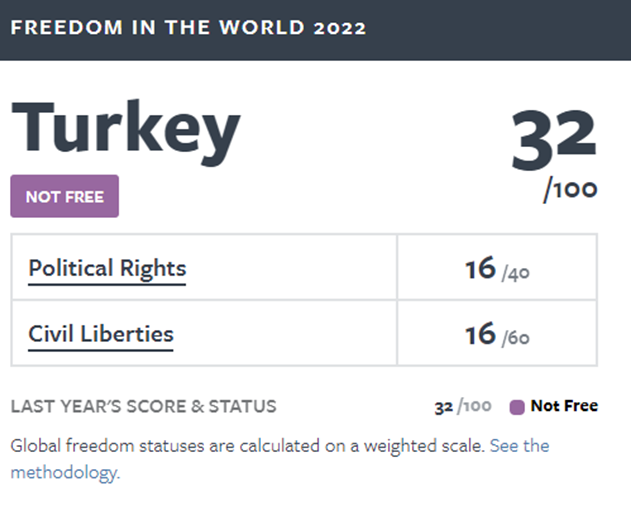
Freedom – Clare Kuczo
| Series Name | Time | Turkiye [TUR] |
| GNI per capita (constant 2015 US$) | 2002 | .. |
| GNI per capita (constant 2015 US$) | 2003 | .. |
| GNI per capita (constant 2015 US$) | 2004 | .. |
| GNI per capita (constant 2015 US$) | 2005 | .. |
| GNI per capita (constant 2015 US$) | 2006 | .. |
| GNI per capita (constant 2015 US$) | 2007 | .. |
| GNI per capita (constant 2015 US$) | 2008 | .. |
| GNI per capita (constant 2015 US$) | 2009 | .. |
| GNI per capita (constant 2015 US$) | 2010 | .. |
| GNI per capita (constant 2015 US$) | 2011 | .. |
| GNI per capita (constant 2015 US$) | 2012 | .. |
| GNI per capita (constant 2015 US$) | 2013 | .. |
| GNI per capita (constant 2015 US$) | 2014 | .. |
| GNI per capita (constant 2015 US$) | 2015 | 10882.96232 |
| GNI per capita (constant 2015 US$) | 2016 | .. |
| GNI per capita (constant 2015 US$) | 2017 | .. |
| GNI per capita (constant 2015 US$) | 2018 | .. |
| GNI per capita (constant 2015 US$) | 2019 | .. |
| GNI per capita (constant 2015 US$) | 2020 | .. |
| GNI per capita (constant 2015 US$) | 2021 | .. |
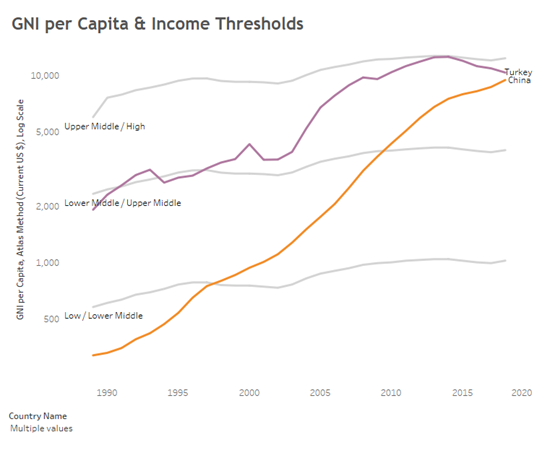
Figure 2b: This shows the GNI per capita (constant 2015 US$). In 2015 Turkey had a GNI per capita of about $10,882.96.
Market indicators – Hailey Draper
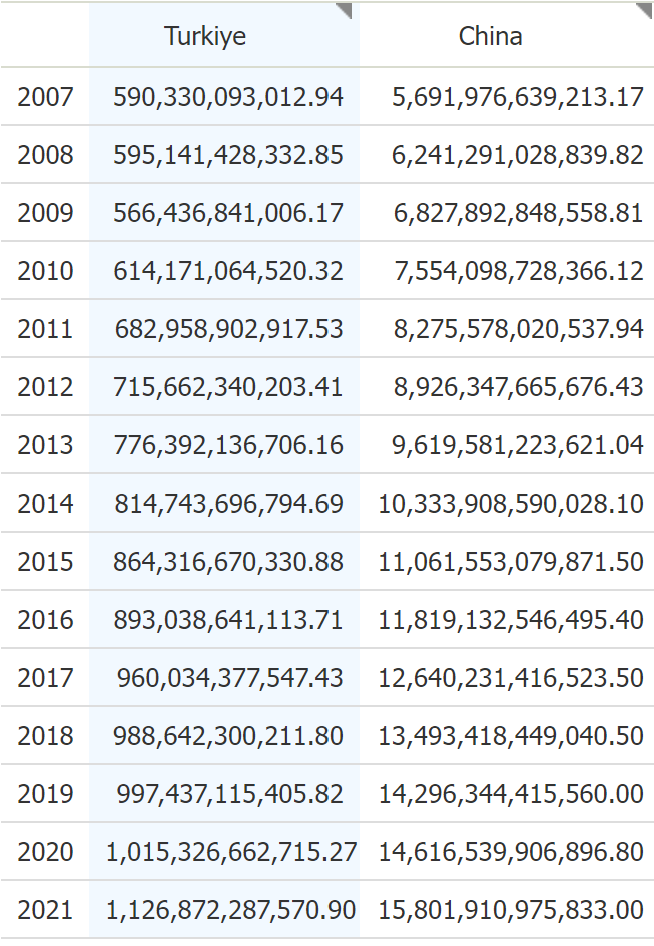
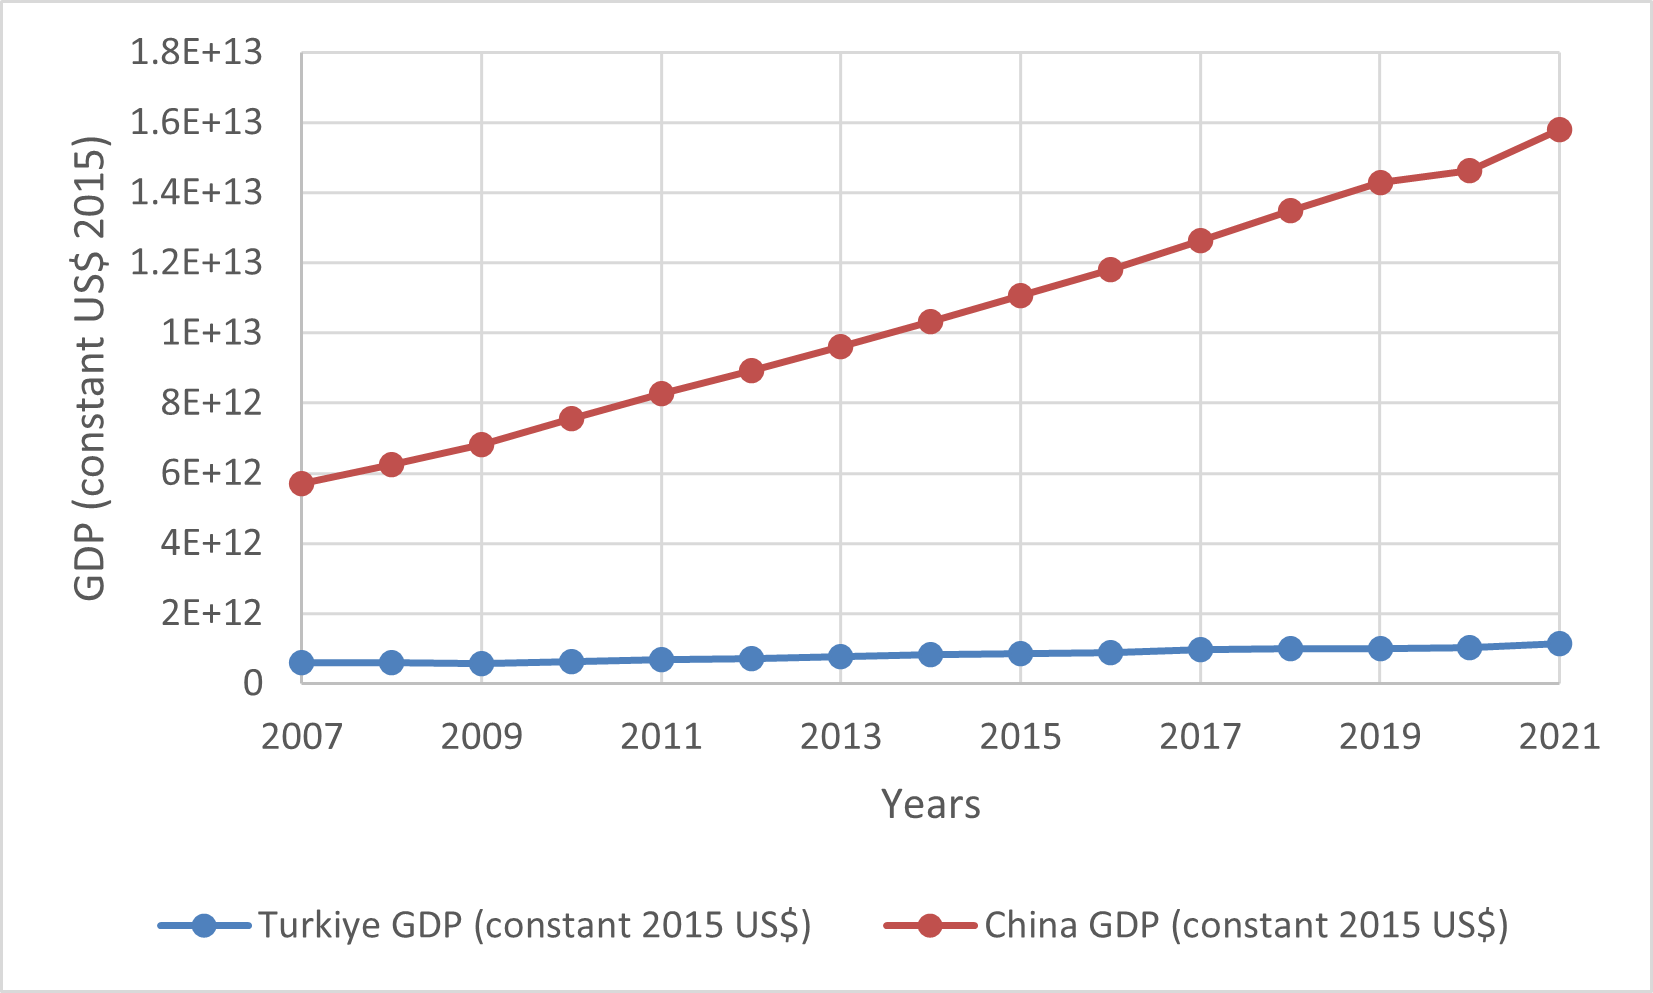
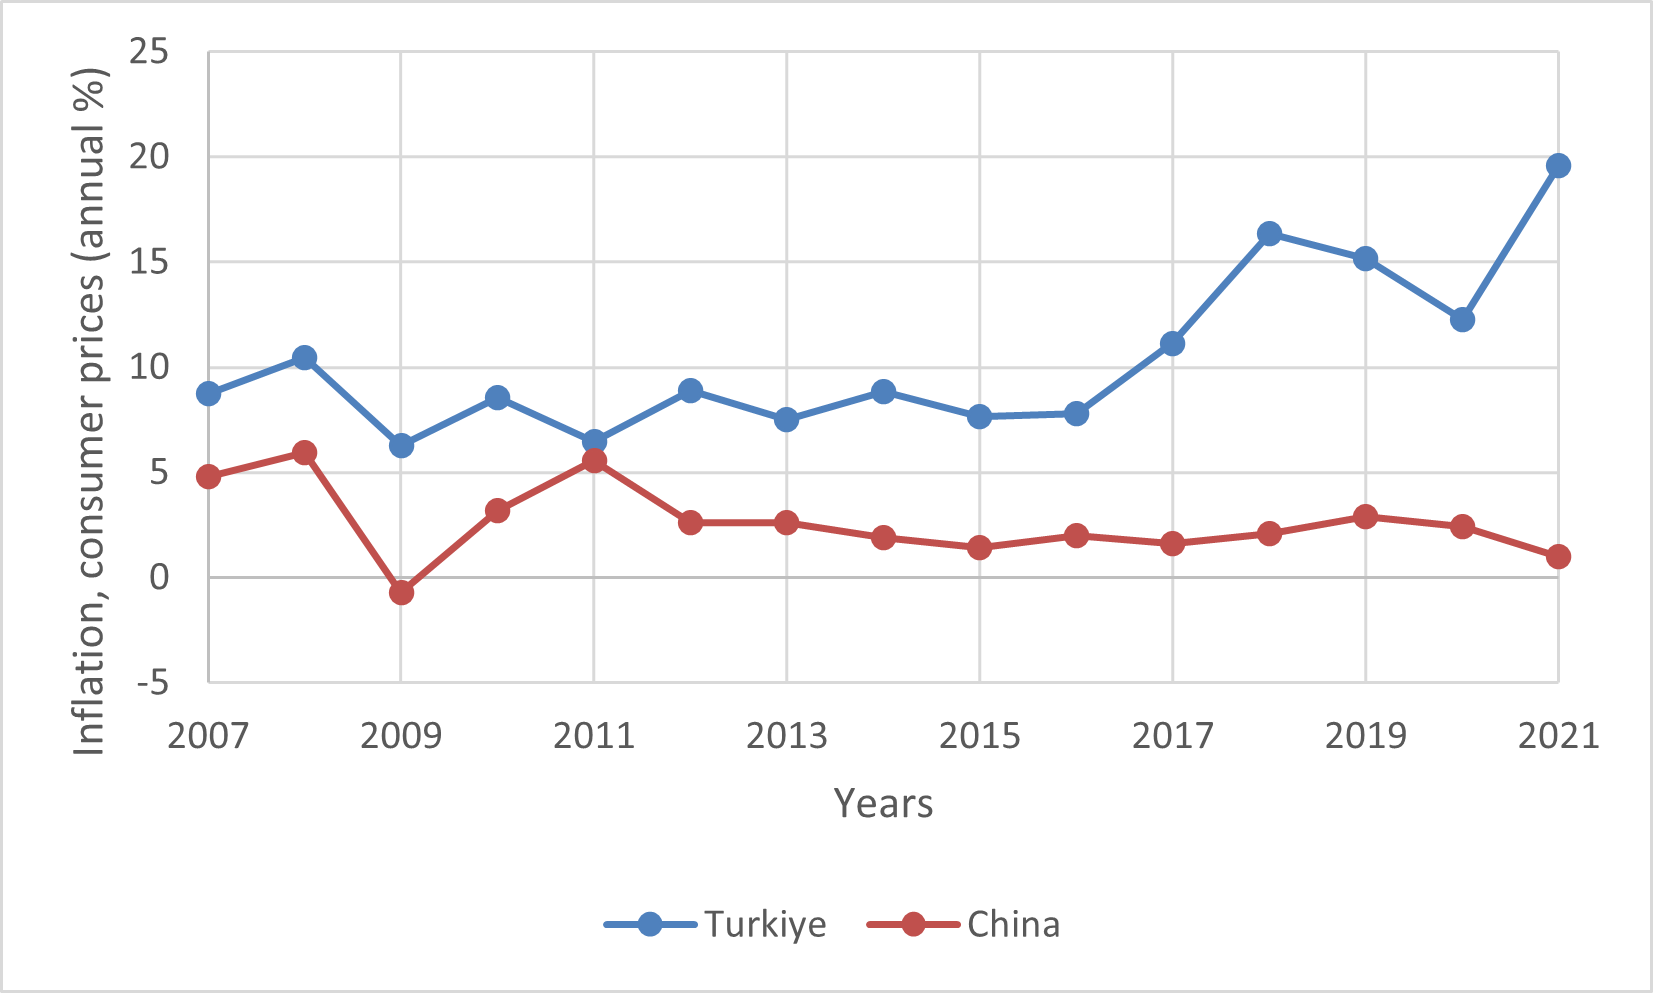
The market indicators we utilized for this project are GDP in terms of 2015 US dollars as an indicator of the market size, GDP growth represented as an annual percentage as an indicator of market potential, and market inflation represented as an annual percentage.

(annual %) compared to China
(annual %) compared to China
3a. Market Size: From 2007 to 2022, Turkey have had a slight growth in market size. In comparison to China, Turkey’s market size has stayed stagnant.
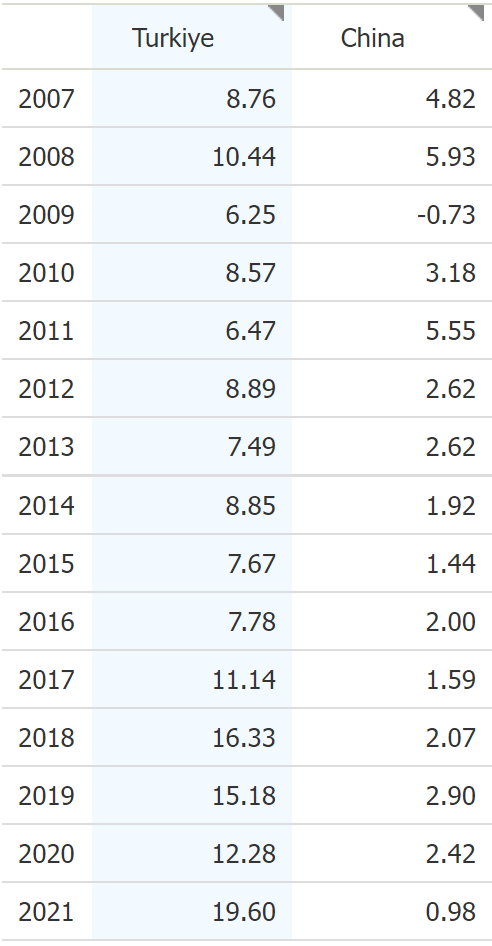
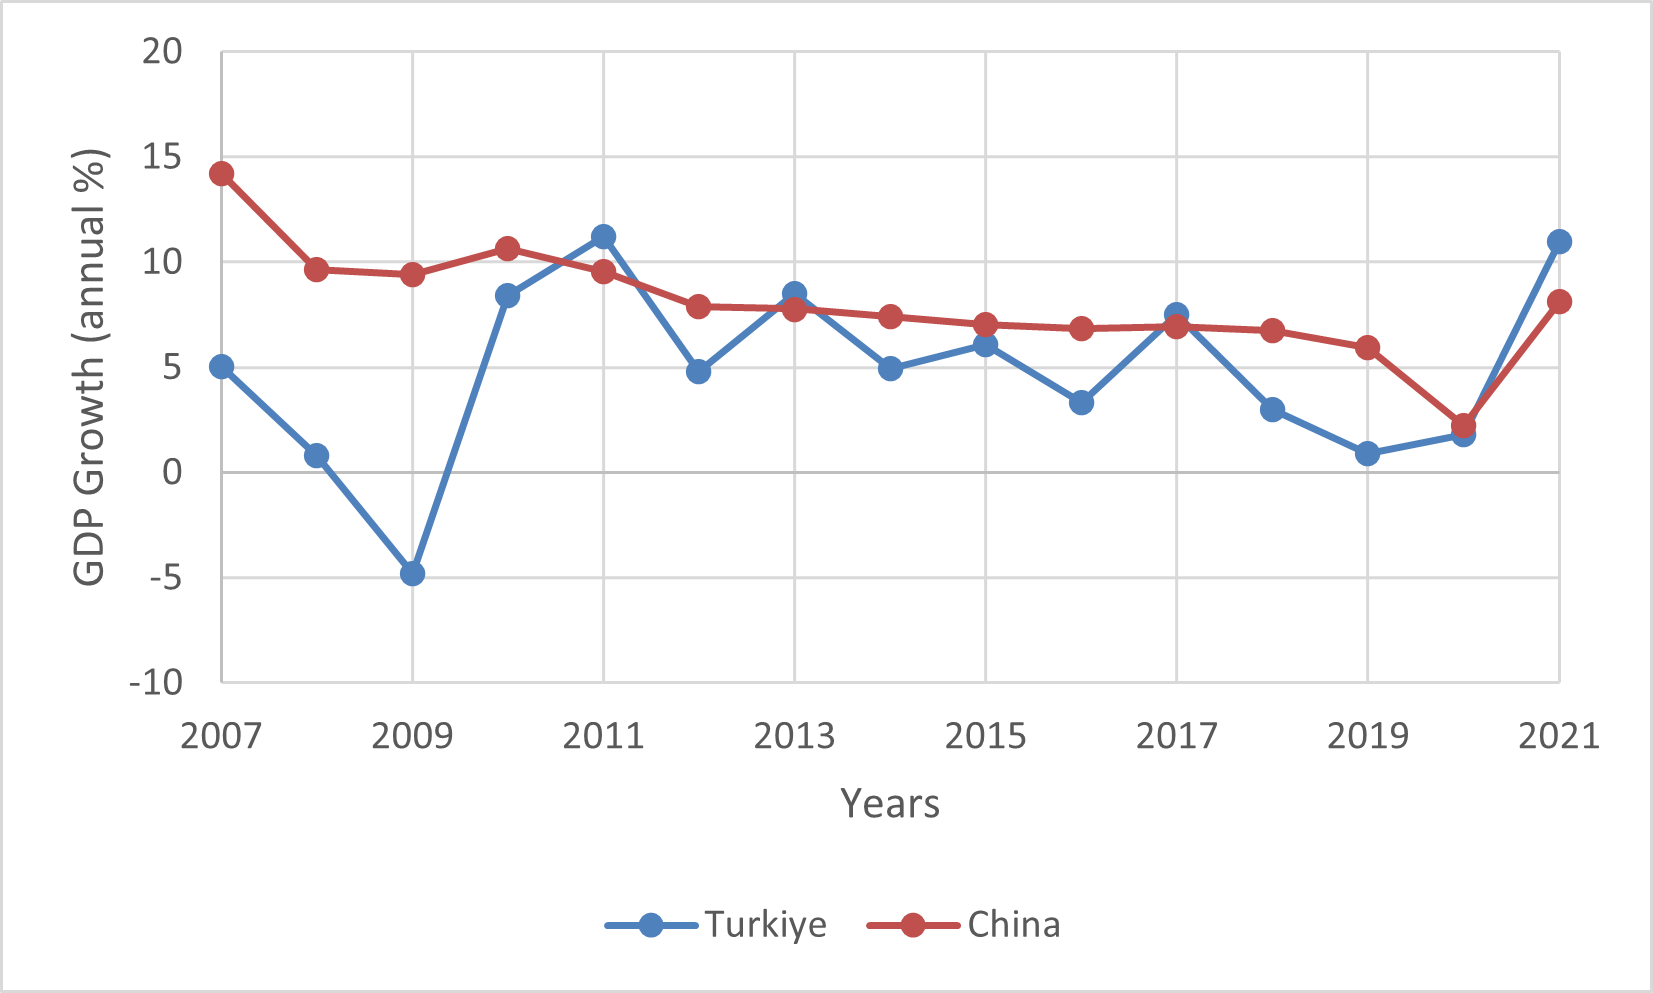
3b. Market Potential: Turkey’s GDP growth in the past 15 years has been a positive percentage except for 2009 where the annual percent was -4.82%. In 2021 there was a spike in market potential for Turkey as GDP growth grew to 10.99%. This spike could perhaps be a response to the increased demand for cheap international goods following the Covid Pandemic.
3c. Market Inflation: consumer prices recently spiked to 19.60% in 2021. This inflation keeps Turkey’s currency undervalued which makes exporting good relatively cheap.
Justice: Control of Corruption & Rule of Law – Sophie Chickering
Control of Corruption
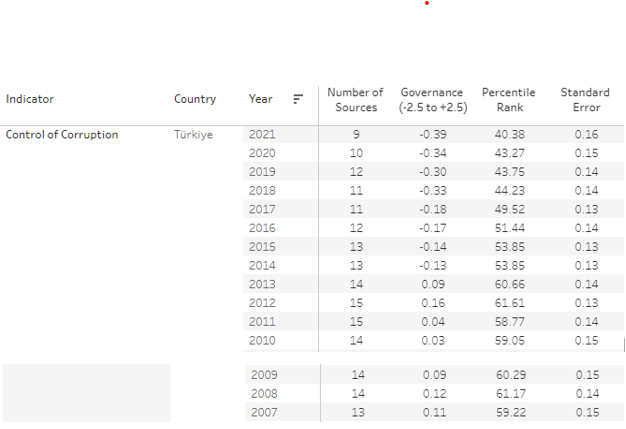
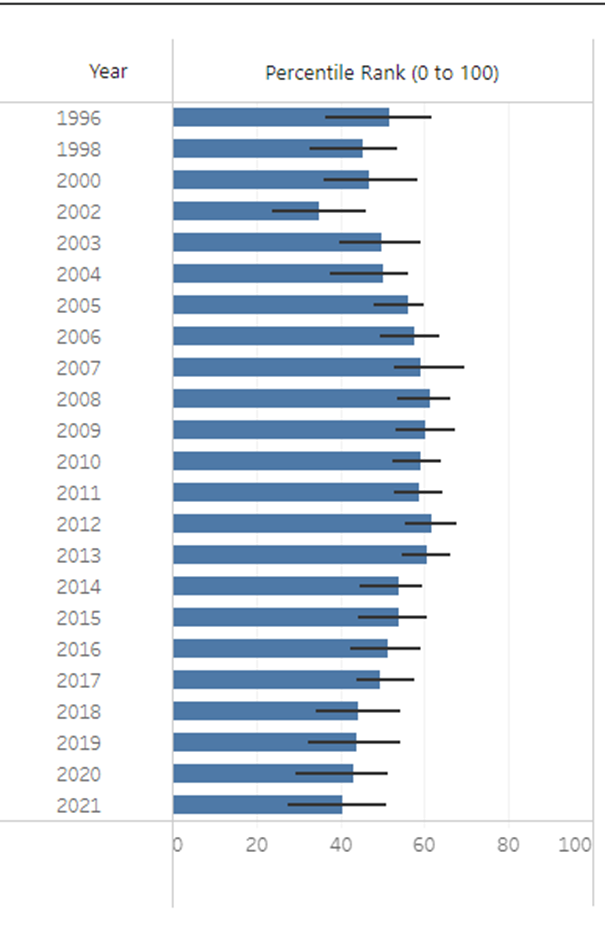
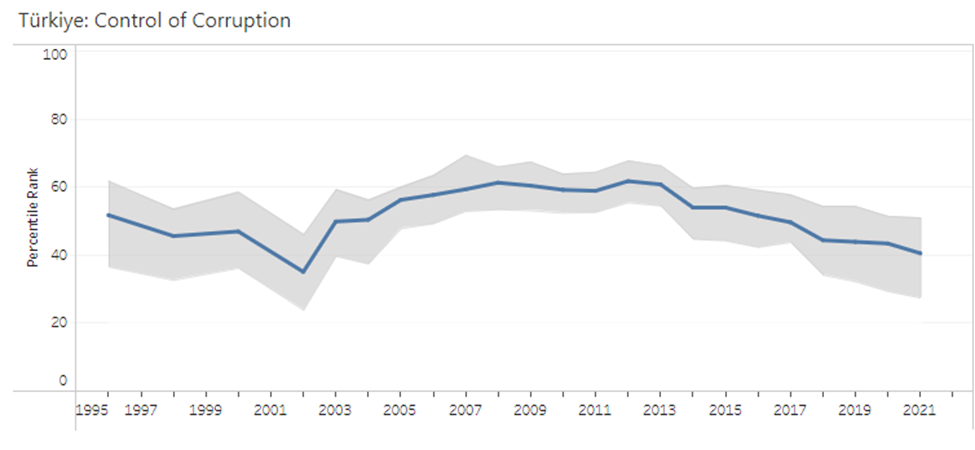
4c: Definition: “Control of corruption captures perceptions of the extent to which public power is exercised for private gain, including both petty and
grand forms of corruption, as well as “capture” of the state by elites and private interests” as defined by the Worldwide Governance Indicators.
Rule of Law
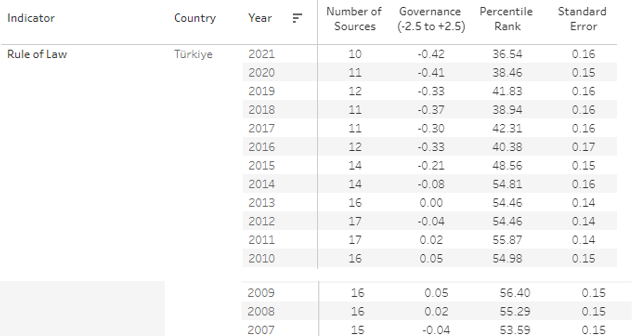

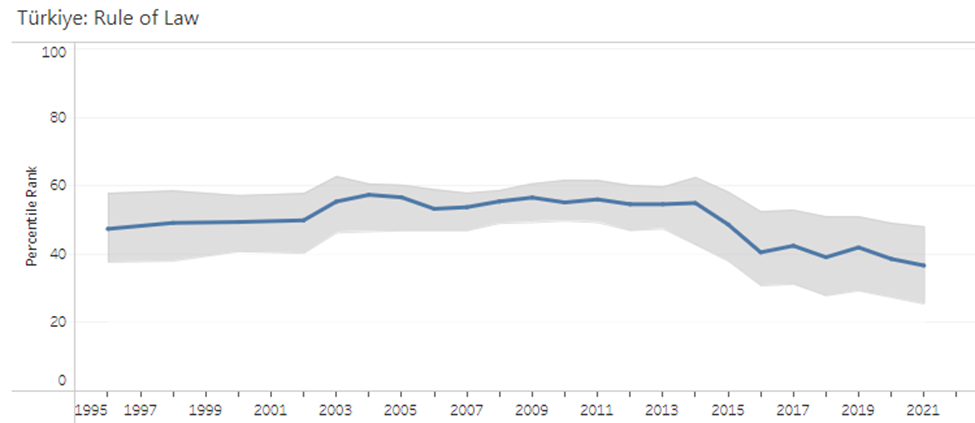
5c:Definition: “Rule of law captures perceptions of the extent to which agents have confidence in and abide by the rules of society, and in particular the
quality of contract enforcement, property rights, the police, and the courts, as well as the likelihood of crime and violence.” as defined by the World Governance Indicators.
Terrorism & Government Effectiveness – Ryan Tucker
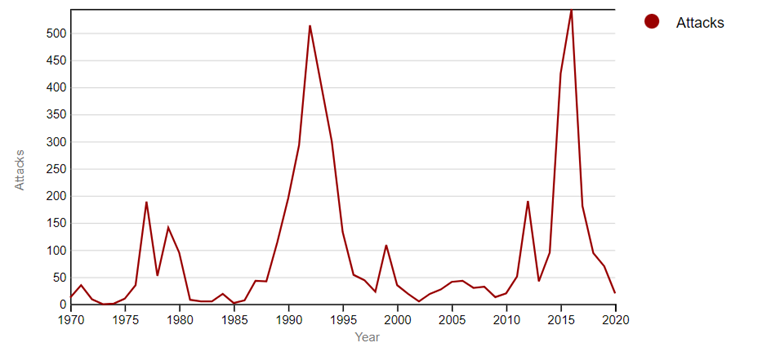
Over the years, Turkey has suffered an increasing amount of terrorist related incidents. Most have been directed to various businesses and organizations. The most common target types in Turkey consists of the Military, Private Citizens, Police and Businesses.

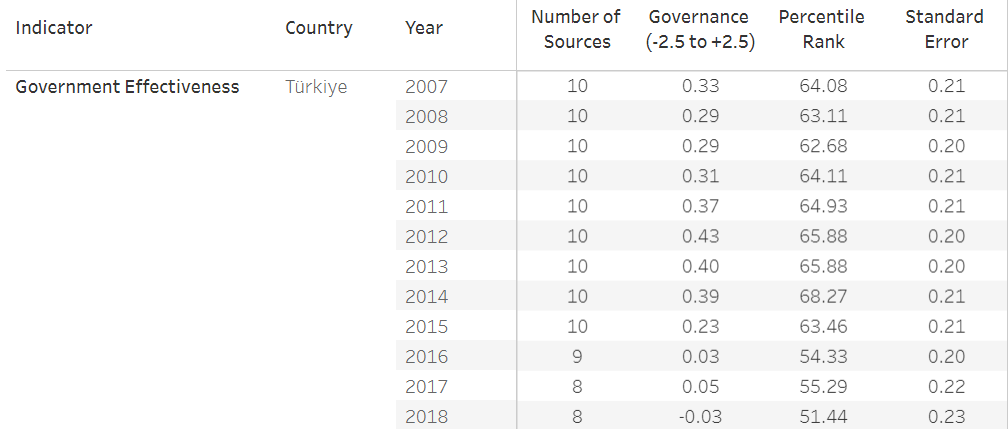
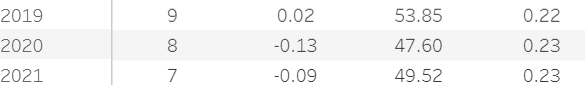
Figure 7A– Table shows the government effectiveness overtime in Turkey.

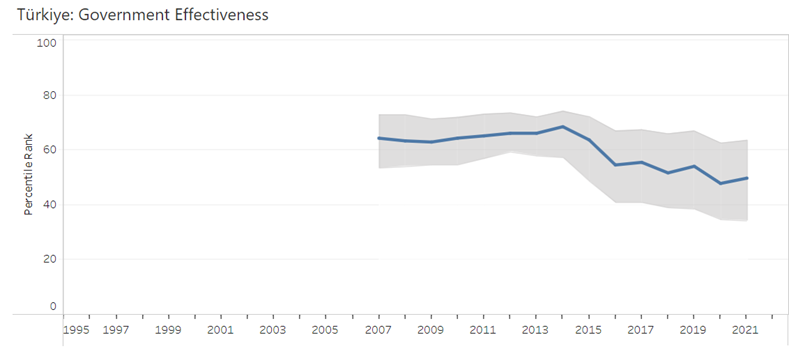
Figure 7B:2– Line graph shows the rate of change in government effectiveness over a fifteen-year period.
Government effectiveness captures the perceptions of the quality of public services, the quality of the civil service and the degree of its independence from political pressures, the quality of policy formulation and implementation, and the credibility of the government’s commitment to such policies.