
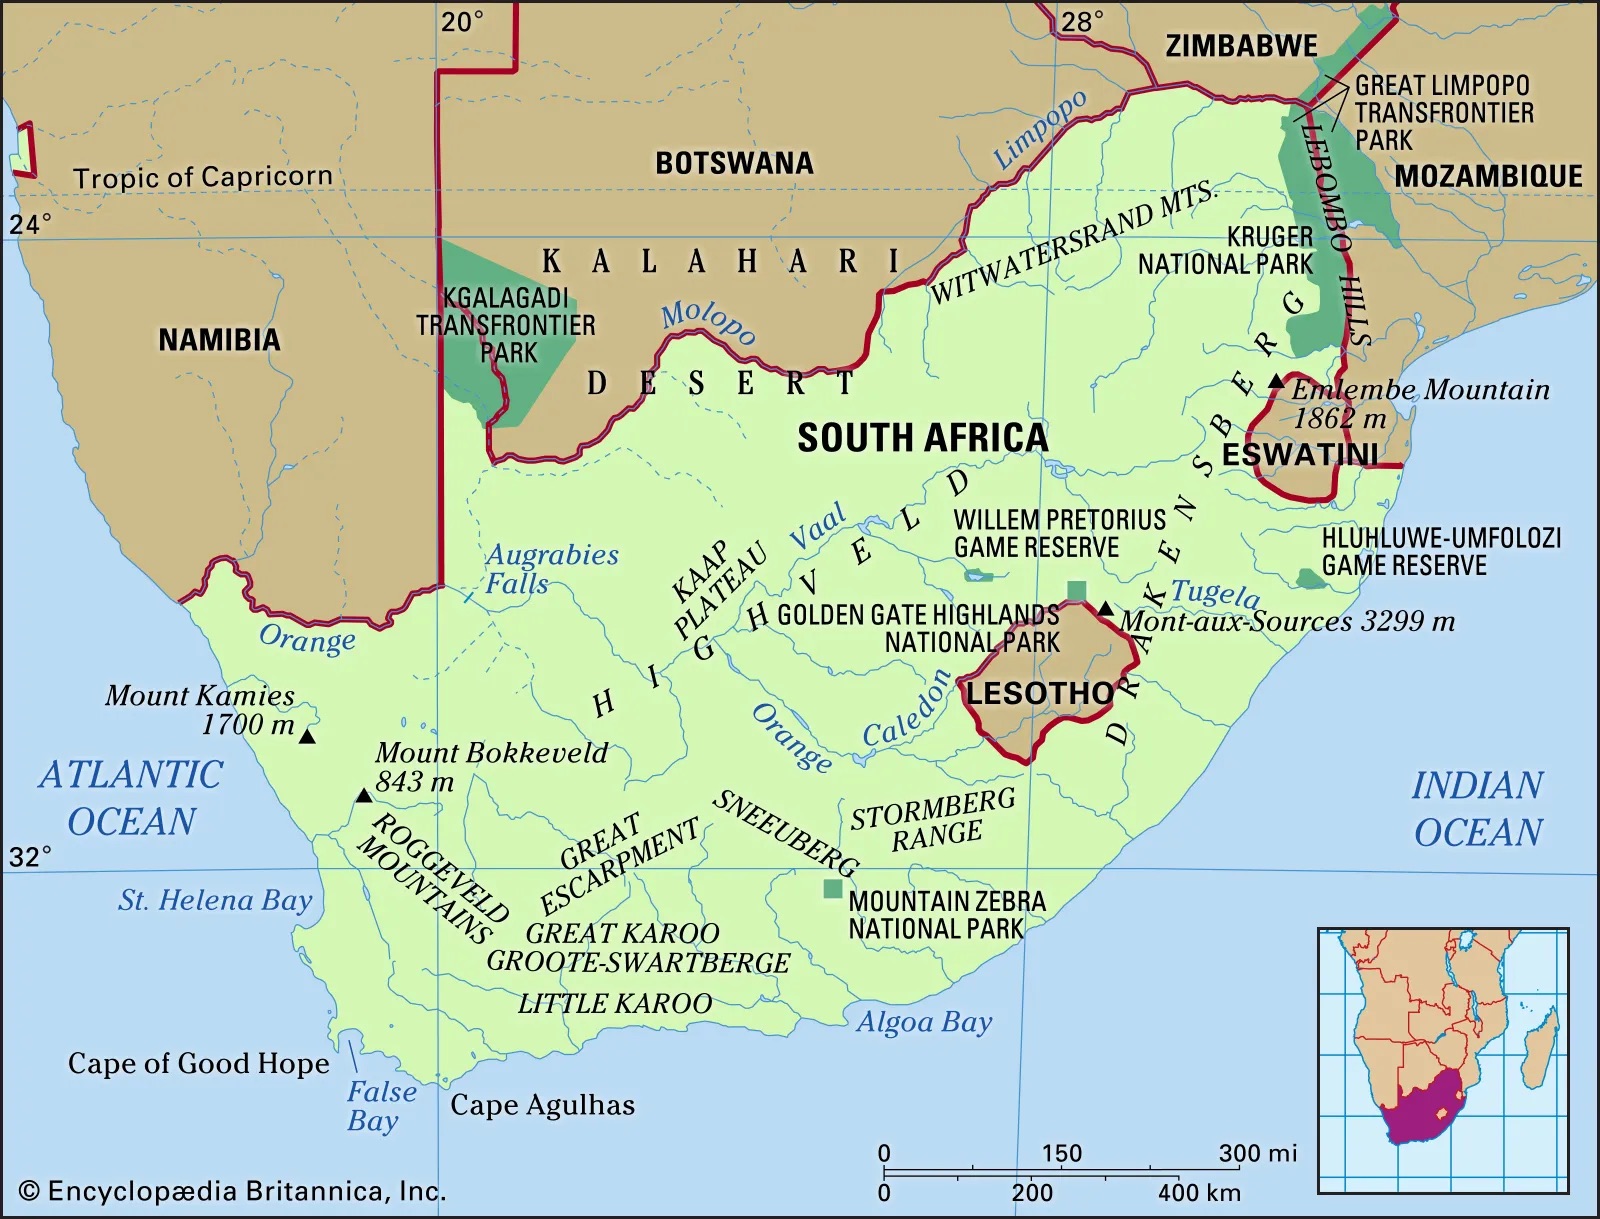
South Africa is in the southmost part of continental Africa. It will have a population of 60.04 Million in 2021. An emerging country with a rising economy.
FREEDOM (By Carlos A. Domacasse)

In terms of political rights, South Africa scores 33/40. They do particularly well on their electoral process as well as free and fair elections. They however struggle with the prominence of third parties.
In terms of Civil Liberties, South Africa scores 46/60. They do particularly well regarding personal freedoms of expression, notably religiously. South Africa, however, struggles with use of force on citizens, as well as LGBTQ liberties.

Over the past three years, the GNI has lowered slightly, however South Africa is still comfortably in the Middle-High income group.
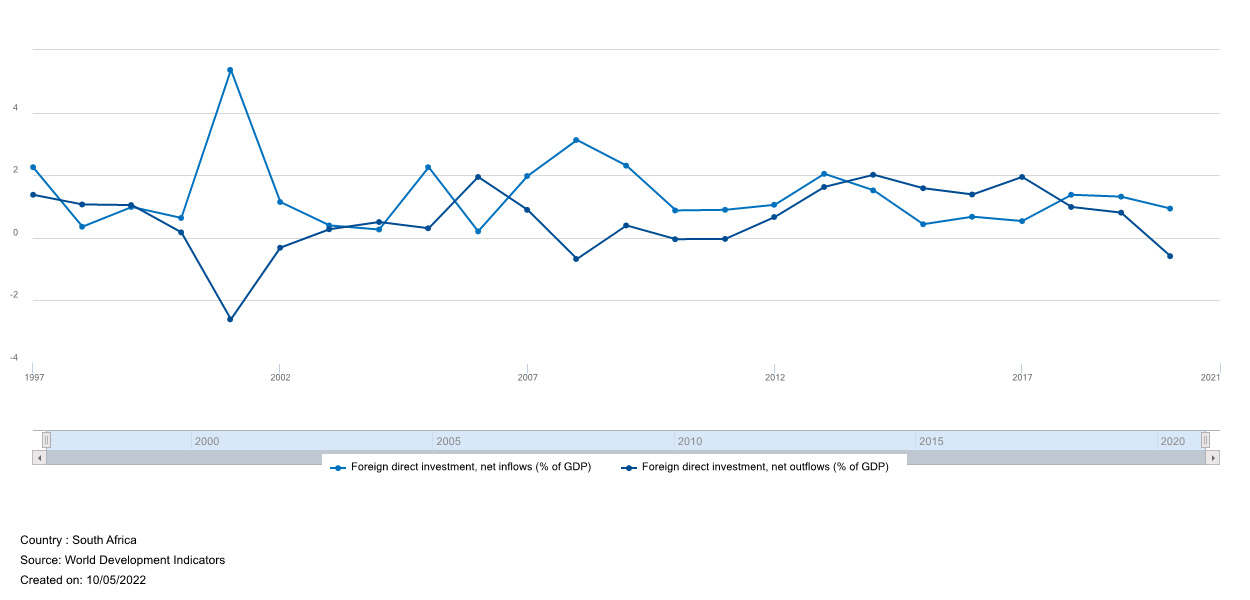
The chart above represents foreign direct investment inflows and outflows in South Africa
Attitude Towards Globalization (Jacob)
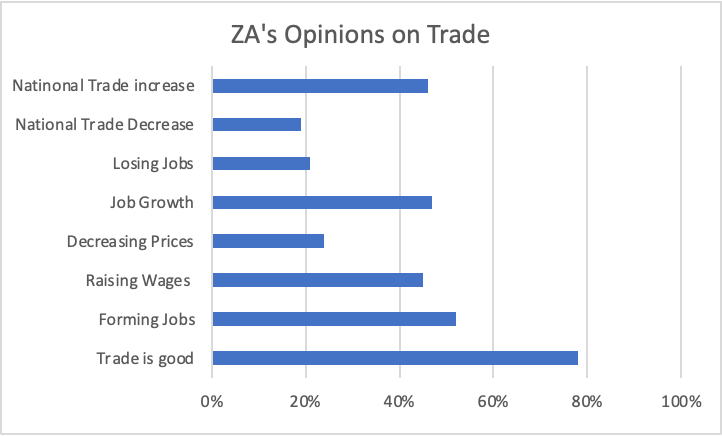
South Africa’s Attitude towards Globalization
In ZA there are a few different views on Trade
78% See Trade as a good thing that will help their country. 52% see it as forming jobs in the country to support the low poverty rate. 45% see it as raising wages nationally. 24% see it as decreasing overall country prices of goods and services. However, 21% see trade as losing jobs in the country making the poverty rate worse. Lastly, 47% of people see job growth in the nation.
The overall National trade opinion stated that 19% of people thought there was a decrease in trade. Whereas, 46% of people saw an increase in trade.
Foreign Companies
70% see foreign companies building in domestic territories as a good thing to help boost the economy. 44% see foreign companies buying domestic companies as a good thing to support their country.

Participation In International Agreements (Jacob)
Participation in International Agreement
South Africa is a member of two organizations, it is a member-state of the EU and SACU. They have many agreements on Free-Trade, including EFTA-SACU FTA, Trade, Development, and Cooperation Agreement (TDCA).
It also has some Preferential trade agreements like the Zimbabwe/ South Africa Bilateral Trade Agreement, GSP, etc.
They also have current trade negotiations, like the SACU-India PTA, SADC_EAC_COMESA Tripartite FTA, and The African Continental Free Trade Area (AfCFTA).

Trade
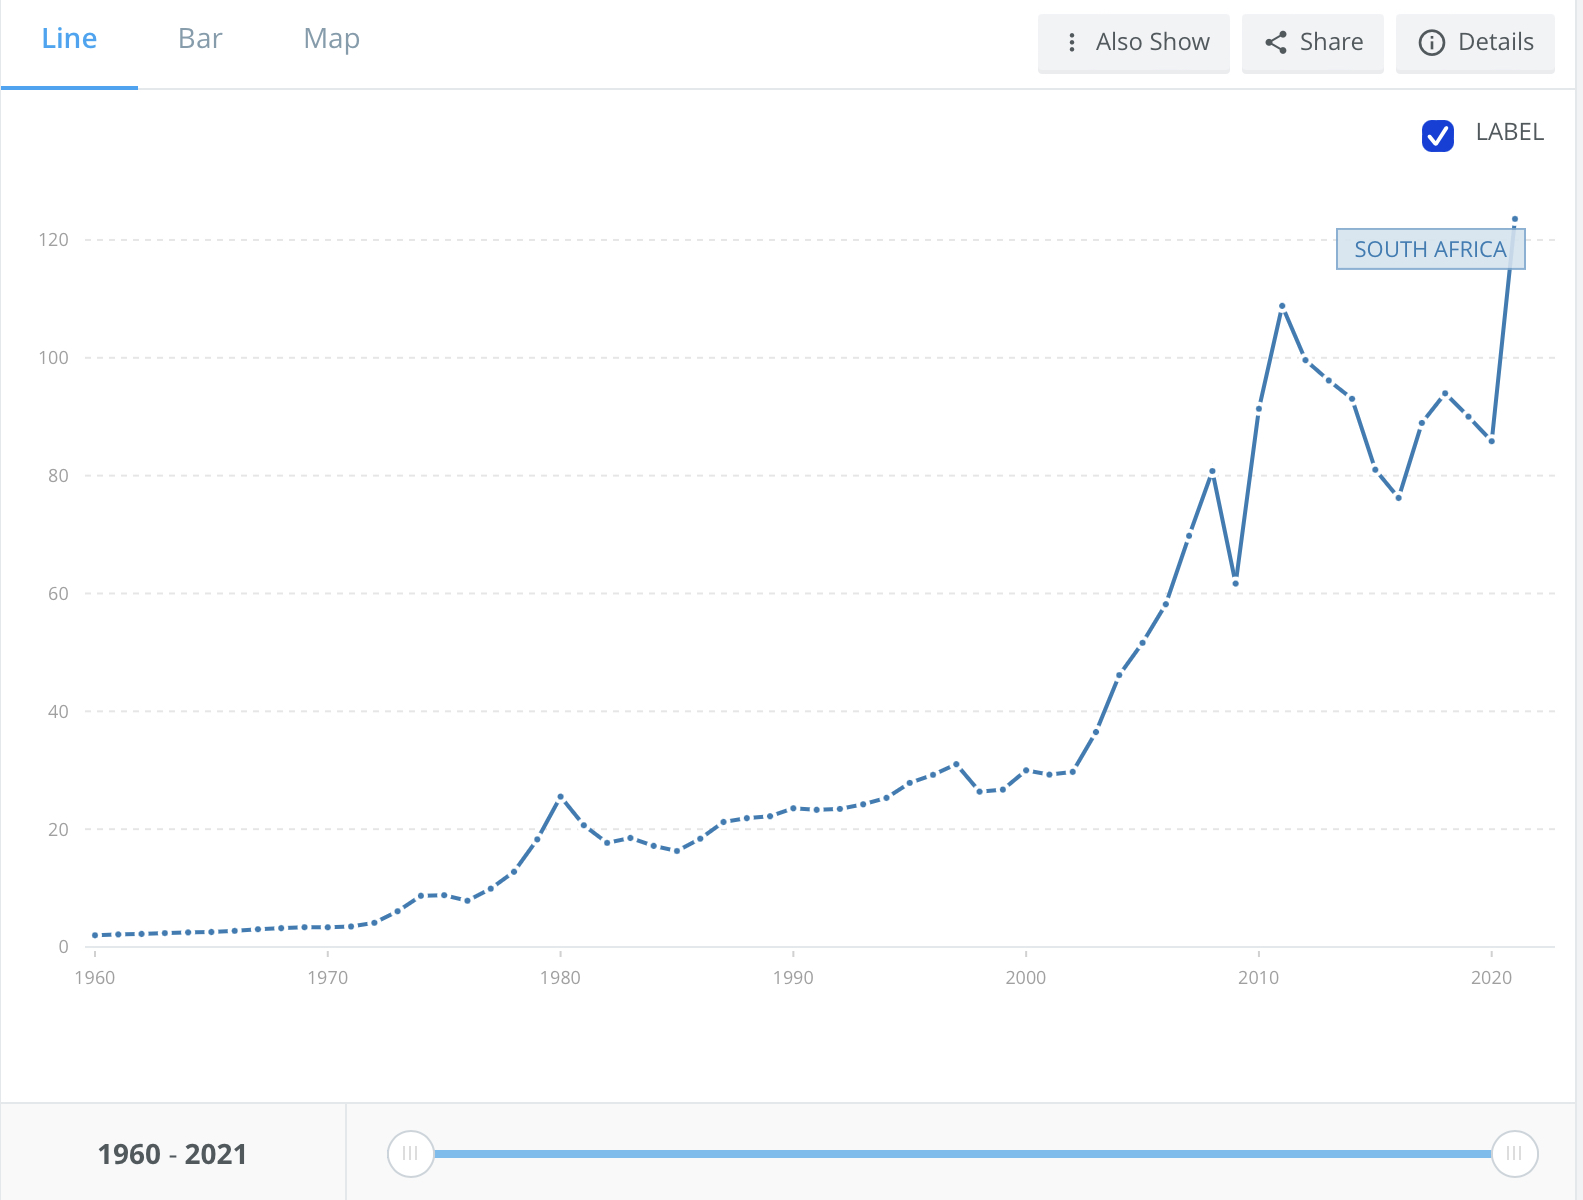
The Graph below represents the imports of goods, services, and primary income (BoP, Current US$) South Africa.
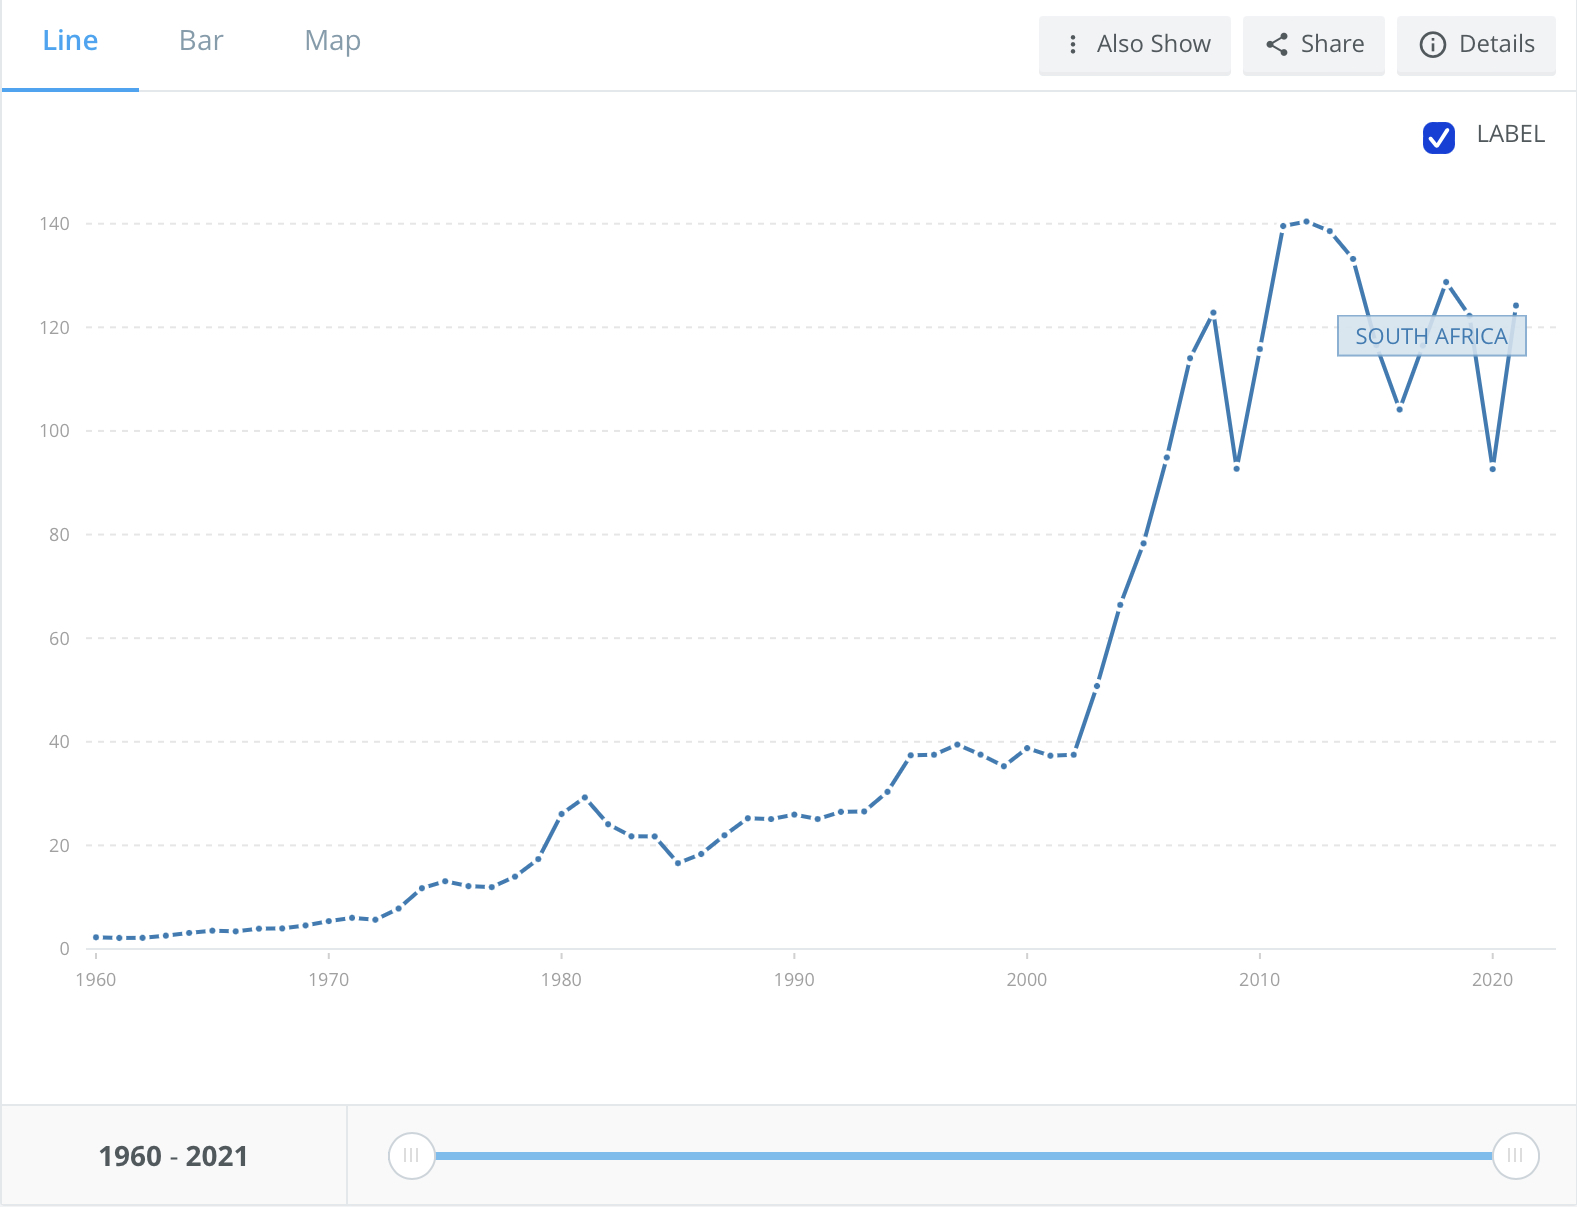
The graph below represents the Exports of goods, services and primary income (BoP, current US$)
6. Terrorism (Jacob H.)
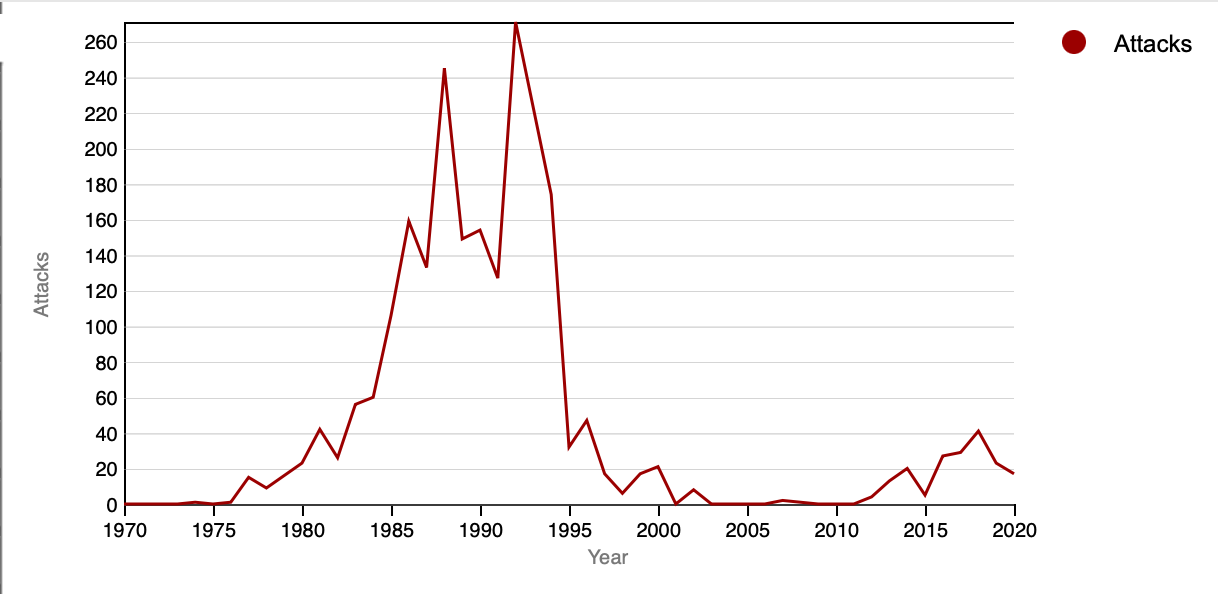
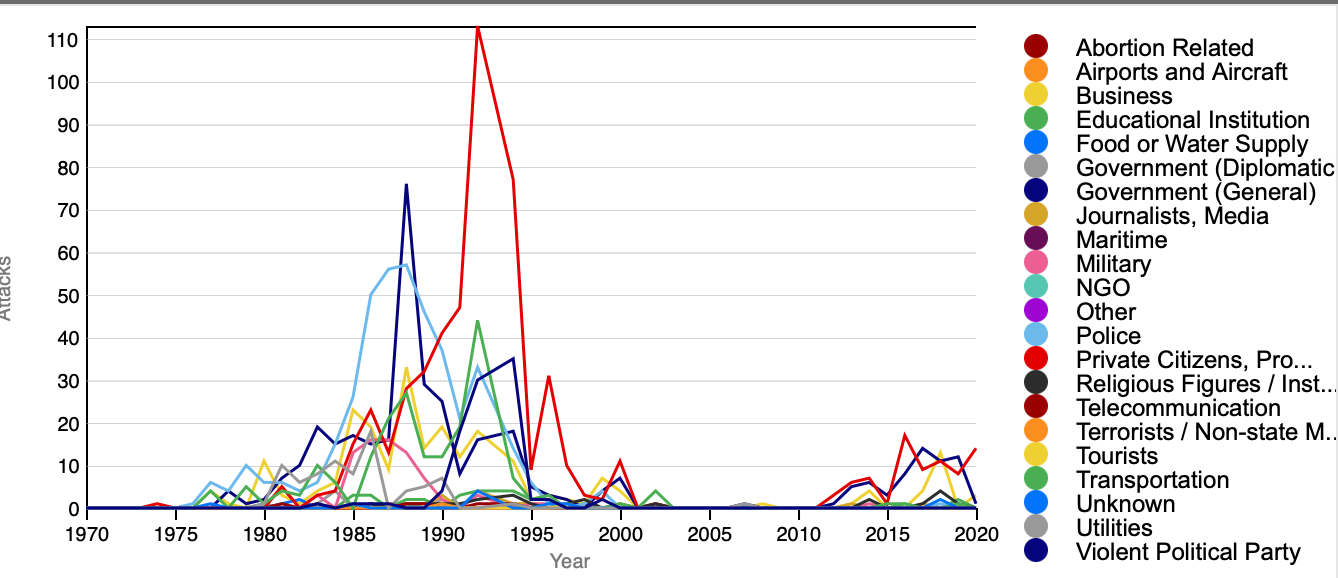
This Chart represents terrorist attacks between the years 1970-2020. You can see the spike in the chart around the ’80s and ’90s, this was due to poor government regulation and abortion rights as can be seen in the next chart.
This chart is the Target type for the terrorist attacks in South Africa during the stated time periods. Abortion rights were a topic of the ’90s causing a big uprising in terrorist attacks. The government was a big target as well between 1985-1999.
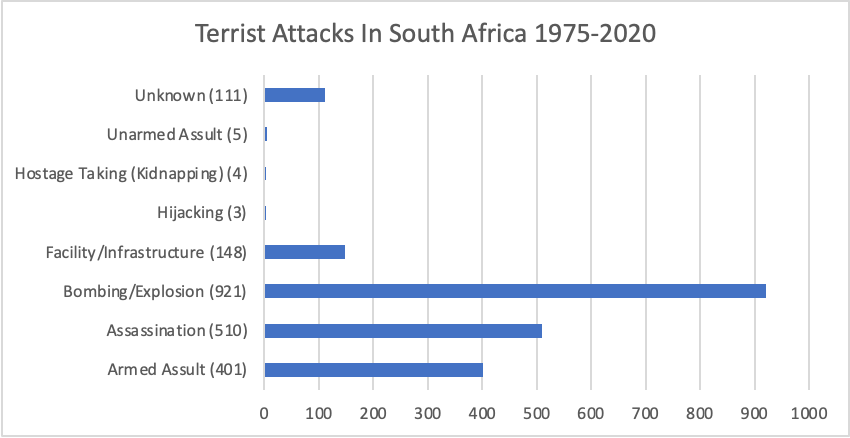
This chart is the amount of the types of terrorist attacks during the time period above.
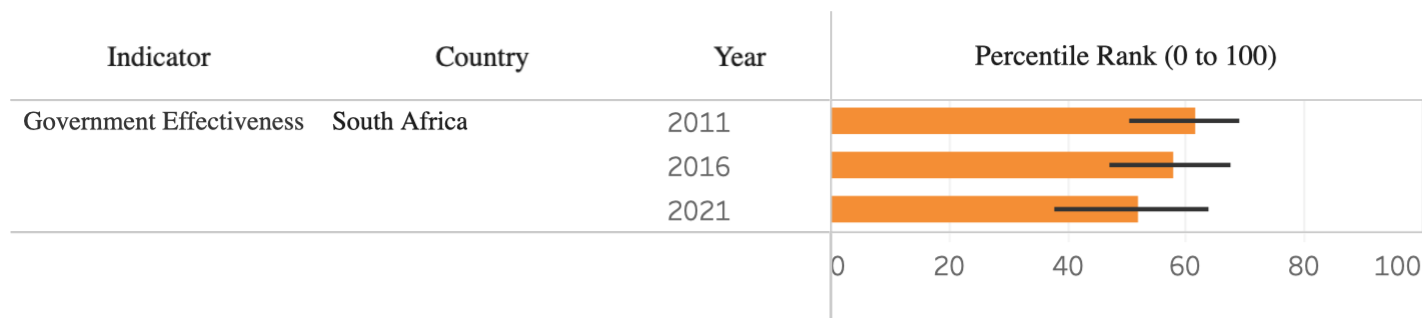
7. Government Effectiveness (Jacob H.)
| Indicator | Country | Year | Number of Sources | Governance (-2.5 to +2.5) | Percentile Rank | Standard Error |
| Government Effectiveness | South Africa | 2011 | 10 | 0.22 | 61.61 | 0.21 |
| 2016 | 11 | 0.13 | 58.17 | 0.18 | ||
| 2021 | 8 | -0.02 | 51.92 | 0.21 |
This table represents the government’s effectiveness and ranks in the three years displayed. Over the 10-year time period, the percentile rank has actually decreased by almost ten percent. Their governance has also decreased by a considerable amount as well.
This is the graph that goes with the table above.
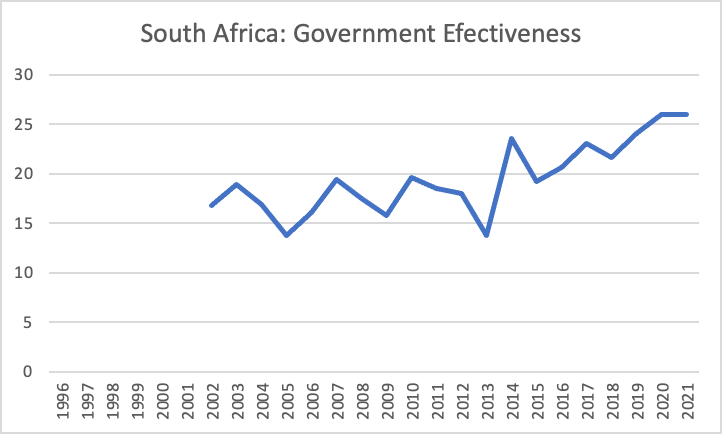
This is representative of the government’s effectiveness over time. The percentile ranks are on the left and you can see the rank rises over time.
Market Indicators
Year: GDP Constant
2007 [YR2007] 297685145427.08
2008 [YR2008] 307184409060.74
2009 [YR2009] 302459639039.78
2010 [YR2010] 311653604140.27
2011 [YR2011] 321528523981.70
2012 [YR2012] 329233094599.26
2013 [YR2013] 337416077838.15
2014 [YR2014] 342186555600.73
2015 [YR2015] 346709790458.56
2016 [YR2016] 349013858372.63
2017 [YR2017] 353055253707.07
2018 [YR2018] 358307364996.50
2019 [YR2019] 358712444718.33
2020 [YR2020] 335640150576.12
2021 [YR2021] 352135530346.98

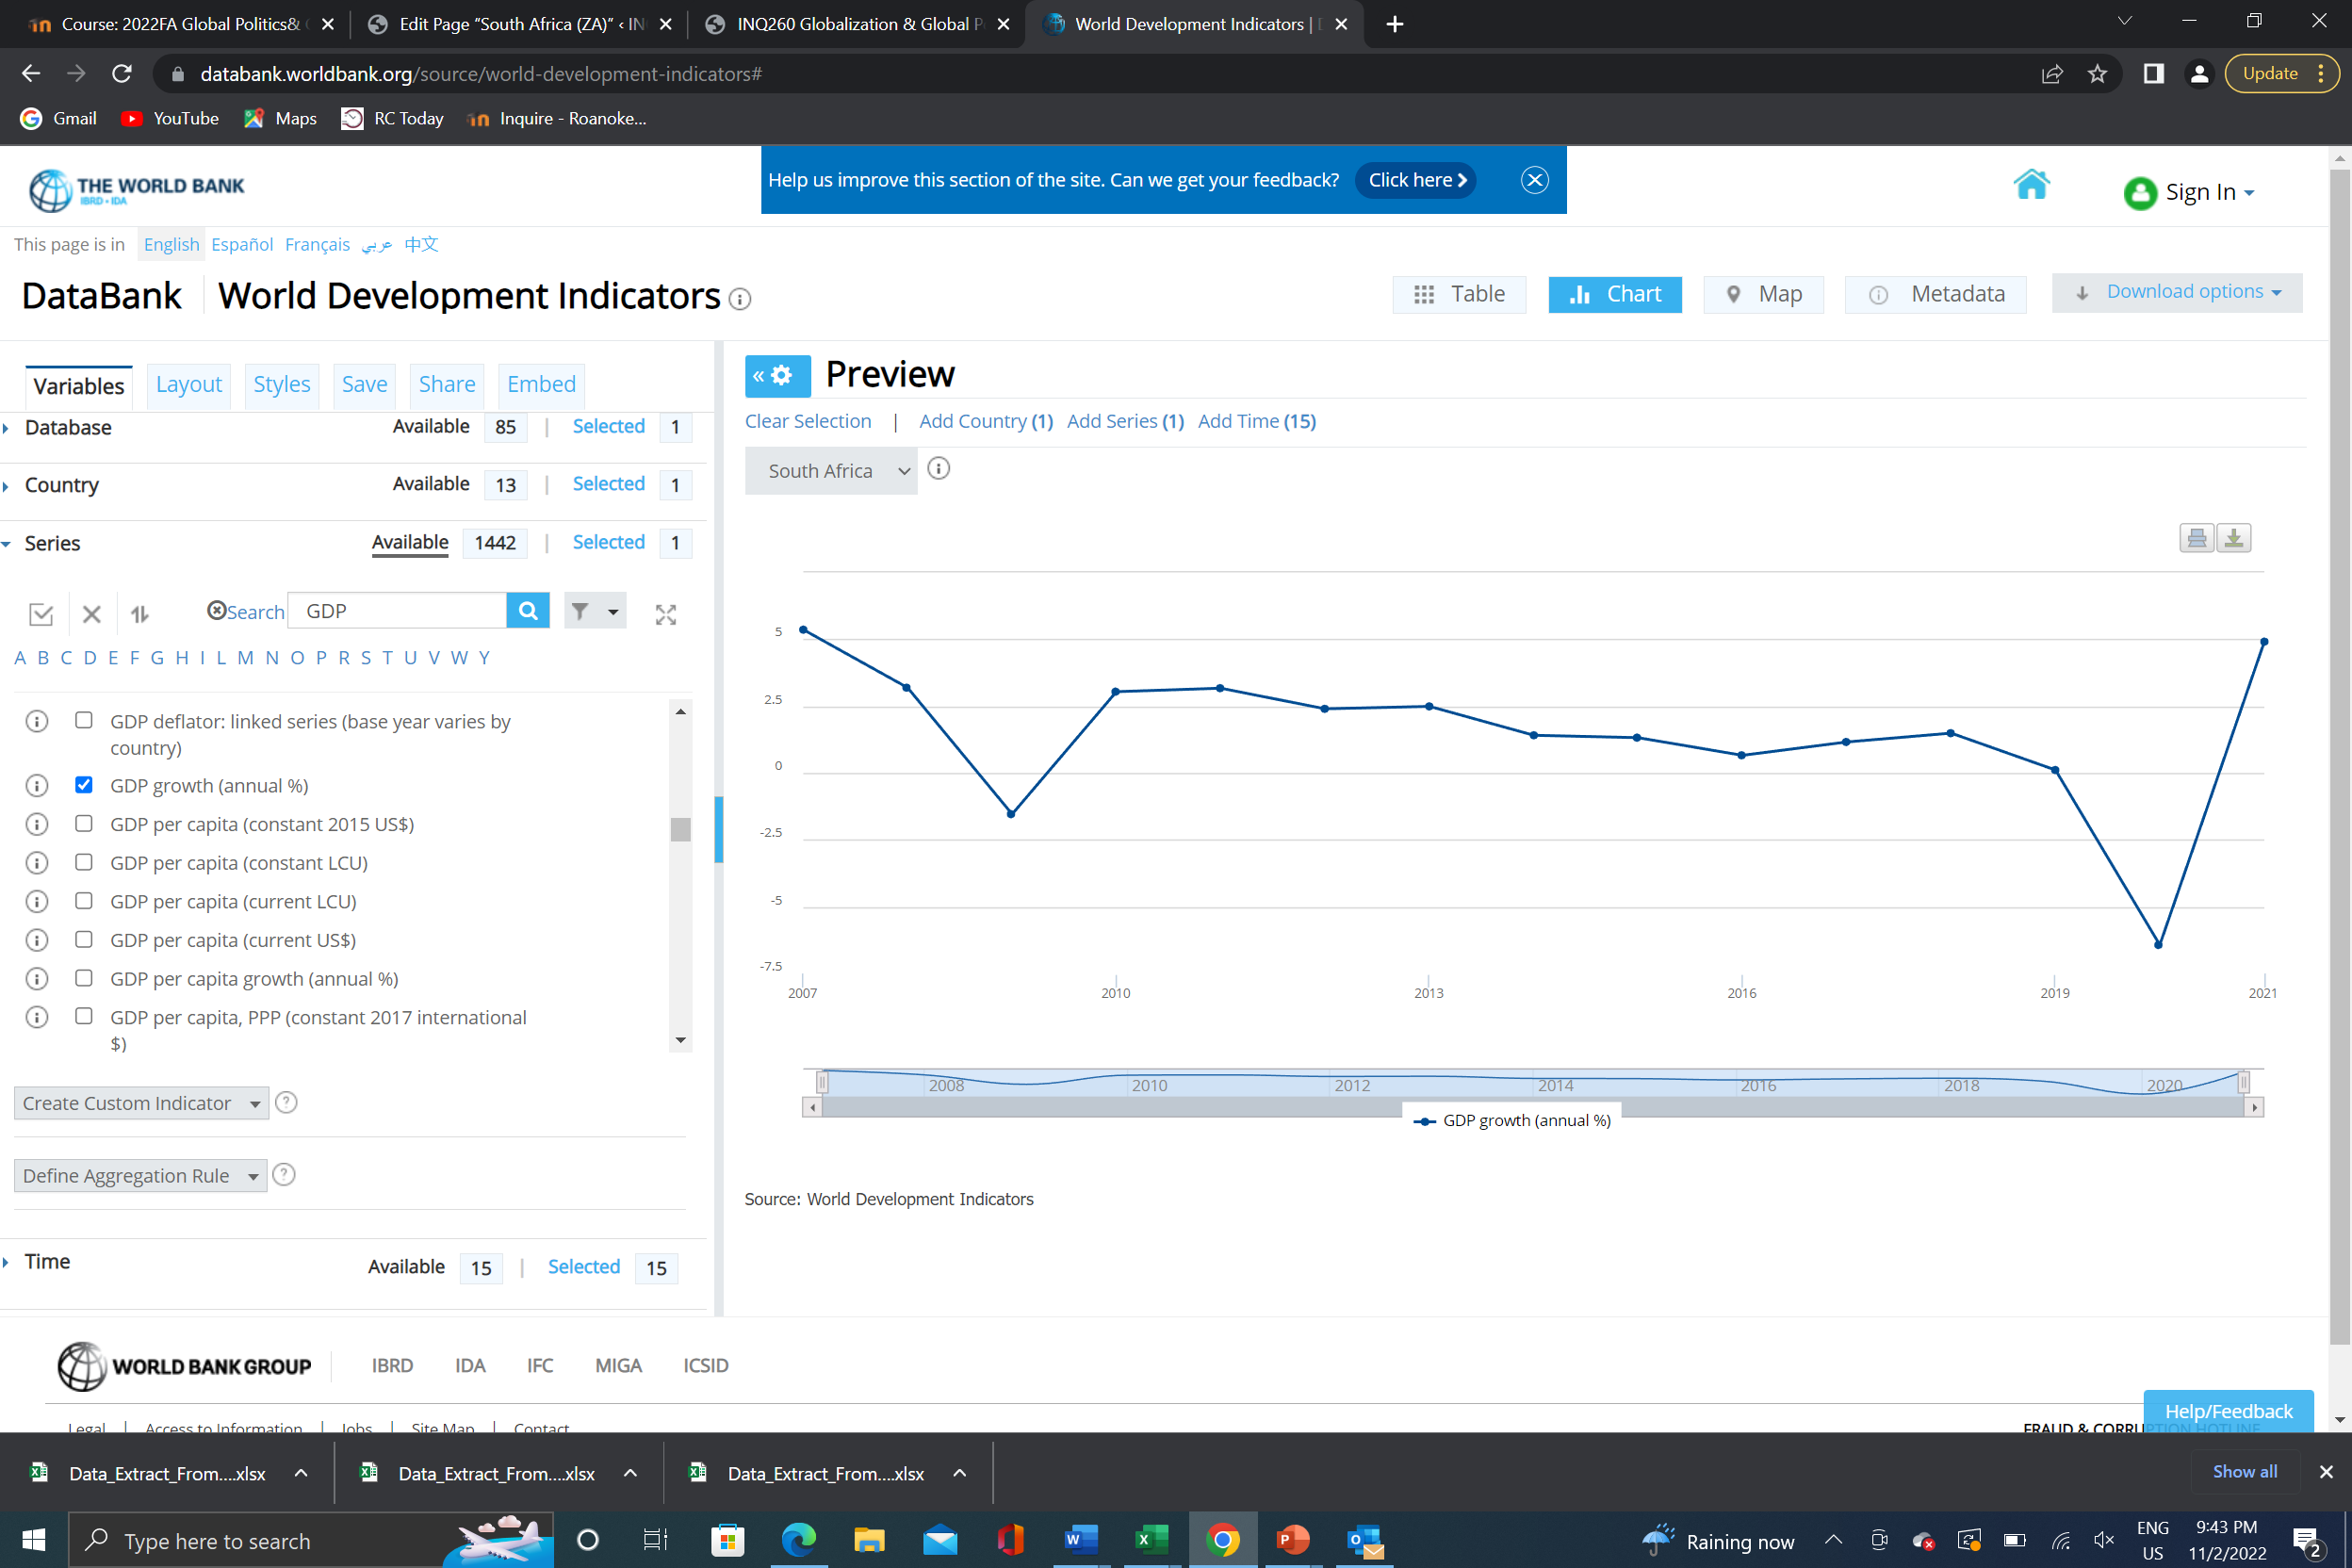
Series Name GDP growth (annual %)
2007 [YR2007] 5.36
2008 [YR2008] 3.19
2009 [YR2009] -1.54
2010 [YR2010] 3.04
2011 [YR2011] 3.17
2012 [YR2012] 2.40
2013 [YR2013] 2.49
2014 [YR2014] 1.41
2015 [YR2015] 1.32
2016 [YR2016] 0.66
2017 [YR2017] 1.16
2018 [YR2018] 1.49
2019 [YR2019] 0.11
2020 [YR2020] -6.43
2021 [YR2021] 4.91
GDP Annual Growth Percentage:
Inflation, consumer prices (annual percentage)
Series Name Inflation, GDP deflator (annual %)
2007 [YR2007] 8.25
2008 [YR2008] 7.85
2009 [YR2009] 8.66
2010 [YR2010] 6.13
2011 [YR2011] 5.54
2012 [YR2012] 4.69
2013 [YR2013] 5.84
2014 [YR2014] 5.37
2015 [YR2015] 5.55
2016 [YR2016] 6.95
2017 [YR2017] 5.47
2018 [YR2018] 3.96
2019 [YR2019] 4.50
2020 [YR2020] 5.27
2021 [YR2021] 7.14
Inflation, consumer prices (annual percentage)
