Introduction:

Sverige, better known to us Americans as Sweden, is the fifth largest country in Europe. It has a population of 10.35 million people as of 2020. It is located in Northern Europe on the Scandinavian Peninsula. The languages spoken in Sweden is Swedish, however you have people who also speak English. Out of the almost 10.5 million people populating Sweden, 9.2 million of them speak English as either a first or second language! The most common religion that people identify as in Sweden is Lutheran, about 60%. Some are other religions where others do not identify all together.
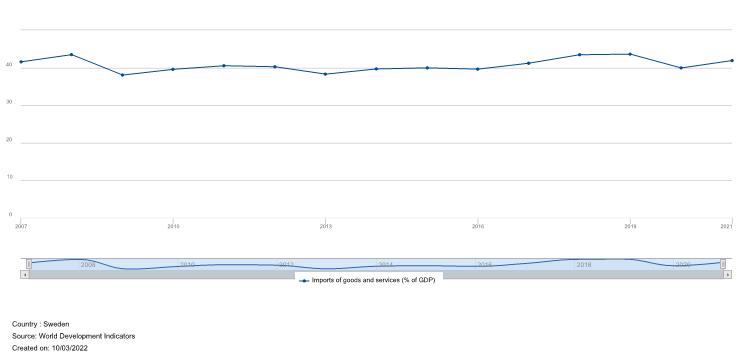
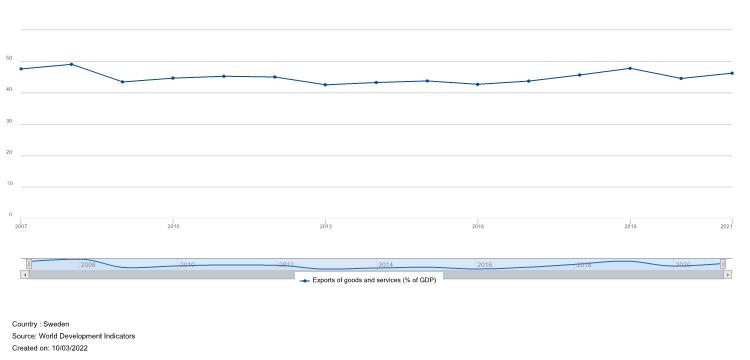
Trade – Madison Wingerter
In order to look at trade, we are going to be looking at trade as percentage of Gross Domestic Product (GDP). We will be graphing total trade, import trade, and export trade all as percentage of GDP relating to Sweden. The graphs shown below are from the last fifteen years, 2007 – 2021. The information was collected using the World Development Indicators found on the World Bank’s Databank.

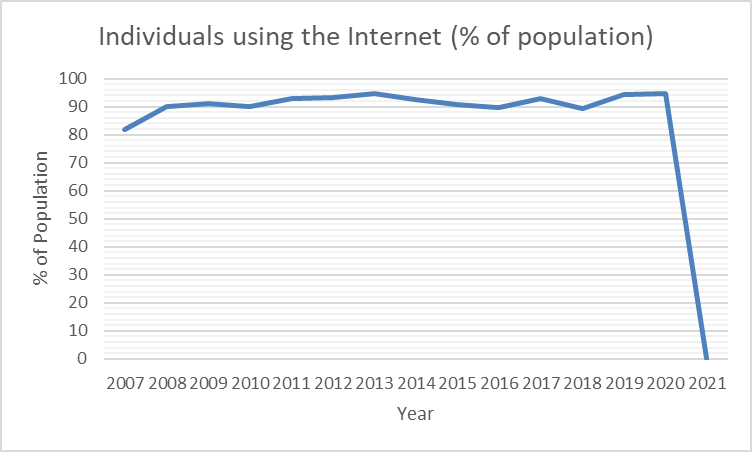
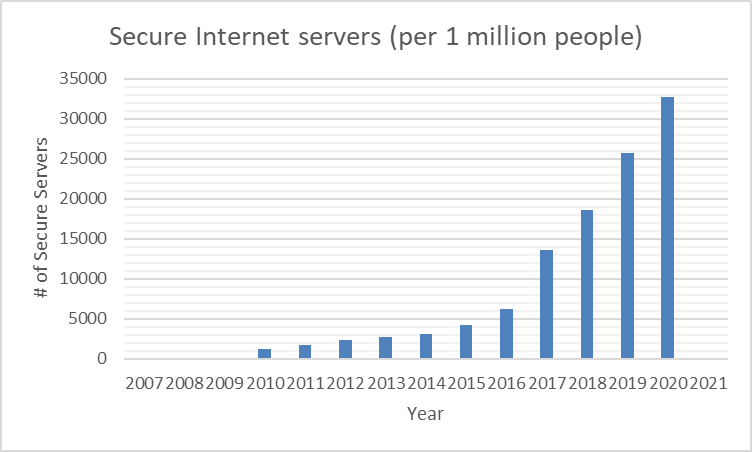
Internet Access– Clare McCurley

Participation in International Agreements – Madison Wingerter
International Agreements
Sweden is a part of the European Union (EU). This means that it cannot make decisions based on or around trade agreements but, Sweden can/does have an “active role” in the nonstop negotiations being made by the European Union. All of the countries included in the European Union are Austria, Belgium, Bulgaria, Croatia, Republic of Cyprus, Czech Republic, Denmark, Estonia, Finland, France, Germany, Greece, Hungary, Ireland, Italy, Latvia, Lithuania, Luxembourg, Malta, Netherlands, Poland, Portugal, Romania, Slovakia, Slovenia, Spain, and Sweden.
https://www.trade.gov/country-commercial-guides/sweden-trade-agreements
Regional Trade Agreements
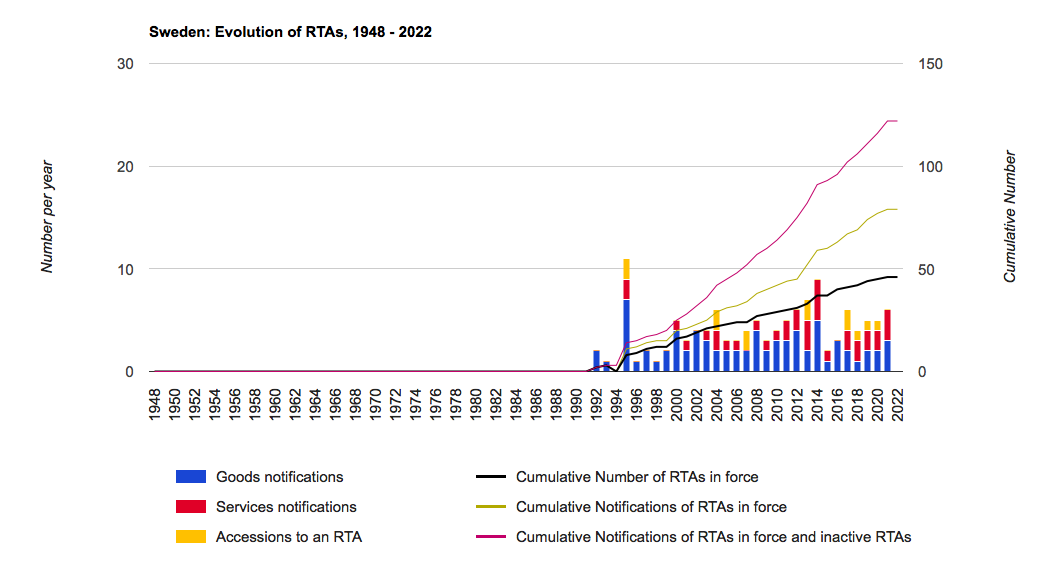
In this graph, it is showing Swedens overall Evolution of RTAs. This graph goes all the way from 1948 to now, however, we are going to focus on the previous fifteen years, 2007-2021. Cumulative number of RTAs in force, cumulative notifications of RTAs in force, and cumulative notifications of RTAs in force and inactive RTAs all increased as the years progressed. Good notifications and service notifications were highest in 2014. Accessions to an RTA were highest in 2008 and 2016.
Bilateral Investment Treaties
| Party | Signature Date | Entry Into Force Data | Reference to ICSID |
| Albania | Mar 31, 1995 | Apr 01, 1996 | Yes |
| Algeria | Feb 15, 2003 | Apr 01, 2005 | Yes |
| Argentina | Nov 22, 1991 | Sep 28, 1992 | Yes |
| Armenia | Feb 08, 2006 | No | |
| Belarus | Dec 20, 1994 | Nov 01, 1996 | Yes |
| Bolivia | Sep 20, 1990 | Jul 03, 1992 | No |
| Bosnia and Herzegovina | Oct 31, 2000 | Jan 01, 2002 | Yes |
| Bulgaria | Apr 19, 1994 | Apr 01, 1995 | No |
| Chile | May 24, 1993 | Feb 13, 1996 | Yes |
| China | Sep 27, 2004 | Sep 27, 2004 | yes |
| China | Mar 29, 1982 | Mar 29, 1982 | No |
| Croatia | Nov 23, 2000 | Aug 01, 2002 | Yes |
| Czechia | Nov 13, 1990 | Sep 23, 1991 | Yes |
| Côte d’Ivoire | Aug 27, 1965 | Nov 03, 1966 | No |
| Ecuador | May 31, 2001 | Mar 01, 2002 | Yes |
| Egypt, Arab Republic of | Jul 15, 1978 | Jan 29, 1979 | Yes |
| Estonia | Mar 31, 1992 | May 20, 1992 | Yes |
| Ethiopia | Dec 10, 2004 | Aug 01, 2005 | No |
| Georgia | Oct 30, 2008 | Apr 01, 2009 | No |
| Guatemala | Feb 12, 2004 | Jul 01, 2005 | Yes |
| Hong Kong | May 27, 1994 | Jun 26, 1994 | No |
| Hungary | Apr 21, 1987 | Apr 21, 1987 | Yes |
| India | Jul 04, 2000 | Apr 01, 2001 | Yes |
| Indonesia | Sep 17, 1992 | Feb 18, 1993 | Yes |
| Iran, Islamic Republic of | Sep 05, 2005 | Mar 02, 2008 | Yes |
| Kazakhstan | Oct 25, 2004 | Aug 01, 2006 | Yes |
| Korea, Republic of | Aug 30, 1995 | Jun 18, 1997 | Yes |
| Kuwait | Nov 07, 1999 | May 10, 2002 | Yes |
| Kyrgyz Republic | Mar 08, 2002 | Apr 01, 2003 | Yes |
| Lao People’s Democratic Republic | Aug 29, 1996 | Jan 01, 1997 | Yes |
| Latvia | Mar 10, 1992 | Nov 06, 1992 | Yes |
| Lebanon | Jun 15, 2001 | Nov 03, 2001 | Yes |
| Lithuania | Mar 17, 1992 | Sep 01, 1992 | yes |
| Madagascar | Apr 02, 1966 | Jun 23, 1967 | No |
| Malaysia | Mar 03, 1979 | Jul 06, 1979 | Yes |
| Malta | Aug 24, 1999 | Jan 01, 2000 | Yes |
| Mauritius | Feb 23, 2004 | Jun 01, 2005 | Yes |
| Mexico | Oct 03, 2000 | Jul 01, 2001 | Yes |
| Mongolia | Oct 20, 2003 | Jun 01, 2004 | Yes |
| Morocco | Sep 26, 1990 | Yes | |
| Mozambique | Oct 23, 2001 | Yes | |
| Nicaragua | May 27, 1999 | May 01, 2003 | No |
| Nigeria | Apr 18, 2002 | Dec 01, 2006 | Yes |
| North Macedonia | May 07, 1998 | Oct 01, 1998 | Yes |
| Oman | Jul 13, 1995 | Jun 08, 1996 | Yes |
| Pakistan | Mar 12, 1981 | Jun 14, 1981 | yes |
| Panama | Jan 15, 2008 | Sep 01, 2008 | Yes |
| Peru | May 03, 1994 | Aug 01, 1994 | yes |
| Philippines | Aug 17, 1999 | Yes | |
| Poland | Oct 13, 1989 | Jan 04, 1990 | No |
| Romania | May 29, 2002 | Apr 01, 2003 | Yes |
| Russian Federation | Apr 19, 1995 | Jun 07, 1996 | No |
| Saudi Arabia | Mar 11, 2008 | Oct 01, 2009 | Yes |
| Senegal | Feb 24, 1967 | Feb 23, 1968 | no |
| Serbia | Nov 10, 1978 | Jun 03, 2006 | yes |
| Slovak Republic | Nov 13, 1990 | Sep 23, 1991 | No |
| Slovenia | Oct 05, 1999 | May 12, 2001 | Yes |
| Slovenia | Nov 10, 1978 | Nov 21, 1979 | Yes |
| South Africa | May 25, 1998 | Jan 01, 1999 | yes |
| Sri Lanka | Apr 30, 1982 | Apr 30, 1982 | Yes |
| Tanzania | Sep 01, 1999 | Mar 01, 2002 | Yes |
| Thailand | Feb 18, 2000 | Nov 23, 2000 | Yes |
| Tunisia | Sep 15, 1984 | May 13, 1985 | Yes |
| Türkiye | Apr 11, 1997 | Oct 08, 1998 | Yes |
| Ukraine | Aug 15, 1995 | Mar 01, 1997 | Yes |
| United Arab Emirates | Nov 10, 1999 | Mar 15, 2000 | Yes |
| Uruguay | Jun 17, 1997 | Dec 01, 1999 | Yes |
| Uzbekistan | May 29, 2001 | Oct 01, 2001 | Yes |
| Venezuela, Republica Bolivariana de | Nov 25, 1996 | Jan 05, 1998 | Yes |
| Vietnam | Sep 08, 1993 | Aug 02, 1994 | Yes |
| Yemen, Republic of | Oct 29, 1983 | Feb 23, 1984 | Yes |
| Yugoslavia, Federal Republic of | Nov 10, 1978 | Nov 21, 1979 | Yes |
| Zimbabwe | Oct 06, 1997 | Apr 01, 1996 | yes |
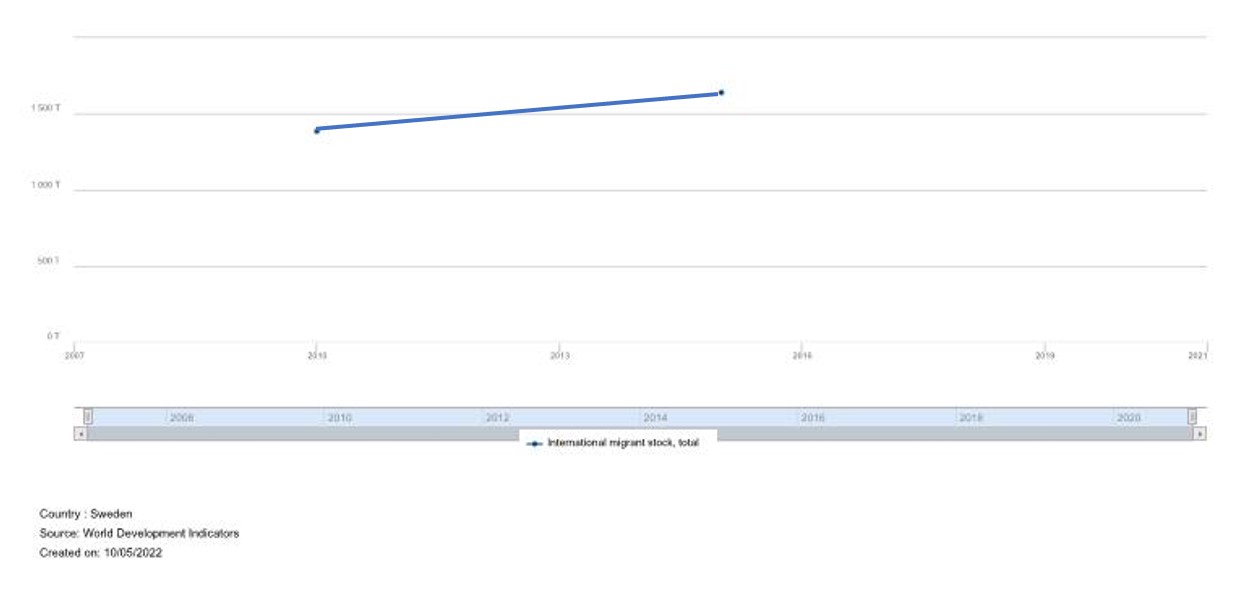
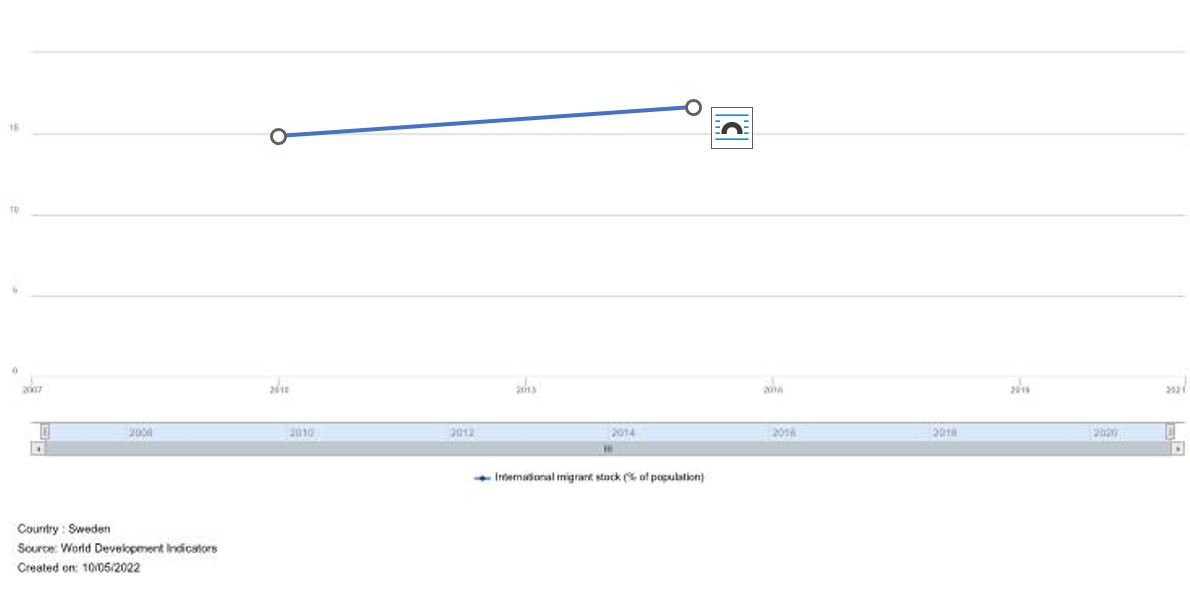
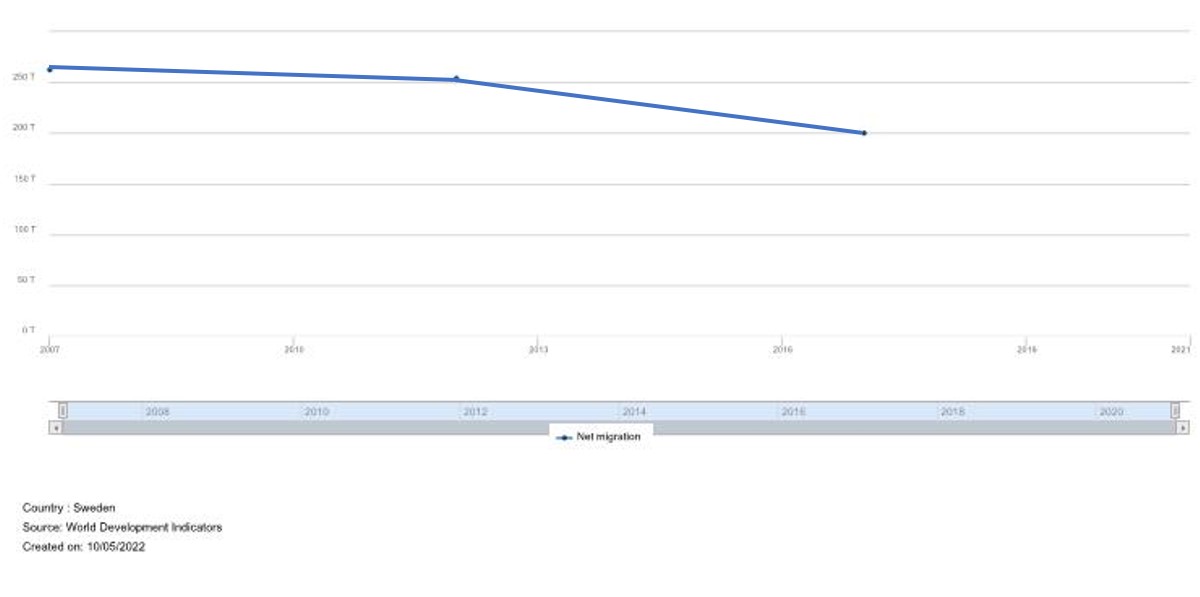
Immigration/ Emigration– Clare McCurley
Foreign Direct Investment Inflows and Outflows
Madison Courts
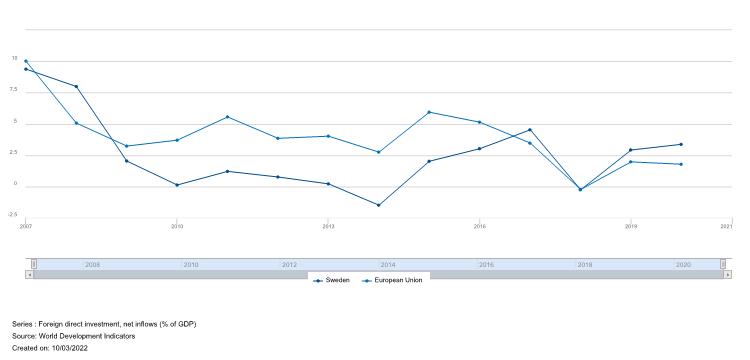
The Foreign Direct Investment Inflows indicator is information on the value of the inward investment made from non-resident investors within the reporting country. The Foreign Direct Investment outflows indicator is information on the value of the outward investments made by the residents of the reporting economy to external economies. Both of theses indicators are represented as percentages of GDP (size of economy) because it shows the importance of Inflow and Outflows to the country’s economy. These graphs reference data from the last 15 years, from 2007 to 2021, and were obtained from the World Development Indicators available through the World Bank’s DataBank. These graphs also include data on EU Foreign Direct Investment inflows and outflows to give a comparison between them and Sweden. The EU was selected as a point of comparison because both Sweden and the EU are developed countries.
| Country | Time | Foreign Direct Investment, Net Inflows (% of GDP) | Foreign Direct Investment, Net Outflows (% of GDP) |
| Sweden | 2007 | 9.39 | 11.38 |
| Sweden | 2008 | 8.00 | 6.72 |
| Sweden | 2009 | 2.05 | 6.06 |
| Sweden | 2010 | 0.13 | 4.46 |
| Sweden | 2011 | 1.22 | 4.14 |
| Sweden | 2012 | 0.77 | 3.17 |
| Sweden | 2013 | 0.22 | 4.75 |
| Sweden | 2014 | -1.48 | -0.65 |
| Sweden | 2015 | 2.03 | 2.95 |
| Sweden | 2016 | 3.03 | 0.25 |
| Sweden | 2017 | 4.54 | 7.36 |
| Sweden | 2018 | -0.25 | 2.31 |
| Sweden | 2019 | 2.93 | 4.26 |
| Sweden | 2020 | 3.38 | 4.27 |
| Sweden | 2021 | N/A | N/A |


Tourism – Krista DeModna
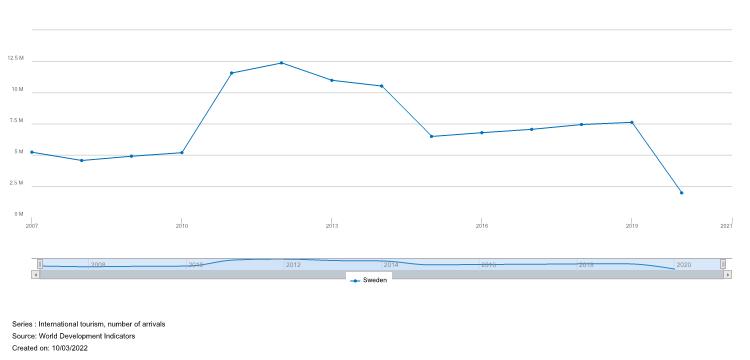
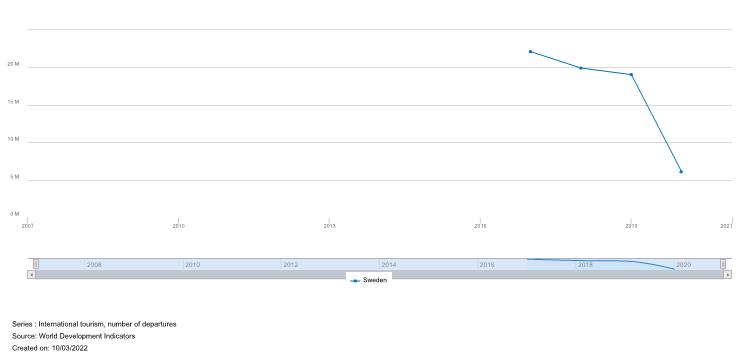
| Country | Year | Number of Arrivals | Number of Depatures |
| Sweden | 2007 | 5224000 | no data |
| Sweden | 2008 | 4555000 | no data |
| Sweden | 2009 | 4899000 | no data |
| Sweden | 2010 | 5183000 | no data |
| Sweden | 2011 | 11567000 | no data |
| Sweden | 2012 | 12372000 | no data |
| Sweden | 2013 | 10980000 | no data |
| Sweden | 2014 | 10522000 | no data |
| Sweden | 2015 | 6482000 | no data |
| Sweden | 2016 | 6782000 | no data |
| Sweden | 2017 | 7054000 | 22121000 |
| Sweden | 2018 | 7440000 | 19939000 |
| Sweden | 2019 | 7616000 | 190610000 |
| Sweden | 2020 | 1957000 | 6081000 |
| Sweden | 2021 | no data | no data |
Attitudes Toward Globalization – Krista DeModna
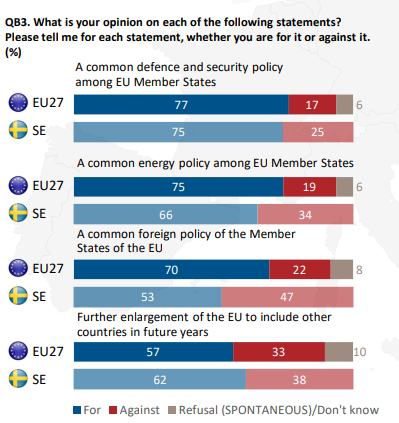
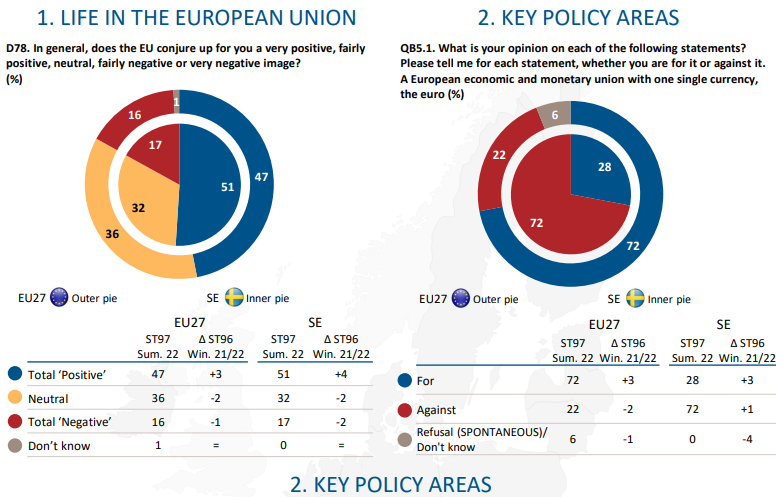
These images show the Swedish populations views and attitudes towards different categories of globalization. Both images show data for who was for, against, neutral and didn’t know, these implications and their effects on globalization in Sweden.
Business Environment
Freedom– Madison Courts
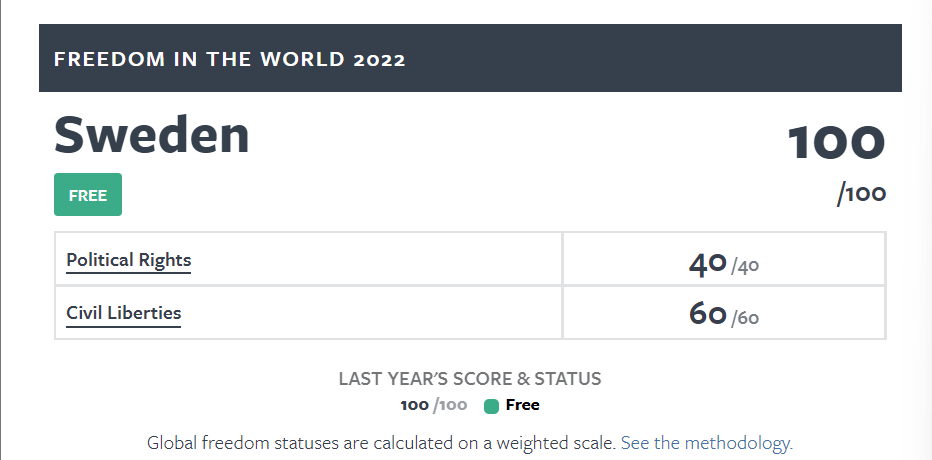
https://freedomhouse.org/countries/freedom-world/scores
In terms of political rights, this country does particularly well on all terms which include electoral process, political pluralism and participation, and functioning of government
In terms of civil liberties, this country does particularly well on all terms which include freedom of expression and belief, associational and organizational rights, rule of law, personal autonomy and individual rights.
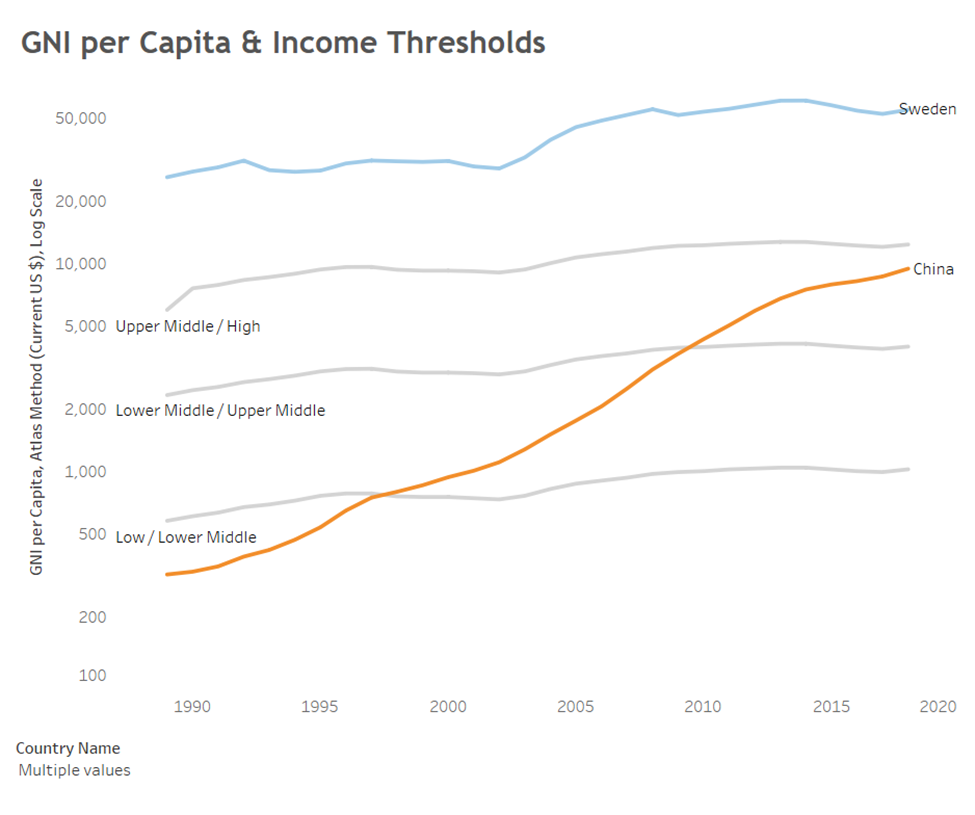
Income– Madison Courts
Income represents the country’s level of development. In this case it is measured through the indicator of GNI per Capita and Income Thresholds. GNI per Capita, stands for Gross National Income of the amount per person. GNI represents the total amount of money earned by a nation’s people and business. We can use this value to track the a nation’s wealth from year to year and includes the nation’s GDP and income that it receives from overseas sources. The first graph represents the GNI per Capita compared to the income thresholds over a span of thirty years from 1990 to 2020 and were obtained from the World Bank from classifying countries by income. The second graph represents the GNI per Capita (constant 2015 US$) and references data from the last 15 years 2007-2021, and was obtained from the World Development Indicators available through the World Bank’s DataBank.
GNI per capita (constant 2015 US$)
| Year | GNI per Capita (constant 2015 US$) |
| 2007 | 50,738.86 |
| 2008 | 50,292.66 |
| 2009 | 47,366.59 |
| 2010 | 49,820.02 |
| 2011 | 50,481.11 |
| 2012 | 49,880.68 |
| 2013 | 49,990.51 |
| 2014 | 50,767.83 |
| 2015 | 51,956.94 |
| 2016 | 52,282.95 |
| 2017 | 53,328.58 |
| 2018 | 53,573.48 |
| 2019 | 54,725.68 |
| 2020 | 53,080.26 |
| 2021 | 55,200.71 |
Market Indicators – Madison Wingerter
Market Size (Madison Wingerter)
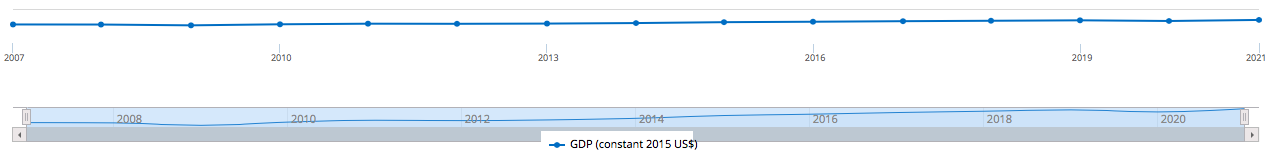
Figure 3a. The market size as indicated by Sweden’s GDP (constant 2015 US$) over a span of fifteen years (2007-2021).
| Year | GDP (constant 2015 US$) |
| 2007 | 449,548,772,840 |
| 2008 | 447,559,127,029 |
| 2009 | 428,135,998,219 |
| 2010 | 453,619,110,973 |
| 2011 | 468,113,753,183 |
| 2012 | 465,359,818,585 |
| 2013 | 470,887,249,502 |
| 2014 | 483,402,482,698 |
| 2015 | 505,103,781,349 |
| 2016 | 515,562,425,649 |
| 2017 | 528,801,679,620 |
| 2018 | 539,113,433,183 |
| 2019 | 549,821,281,948 |
| 2020 | 533,633,543,173 |
| 2021 | 559,251,216,852 |
Market Potential (Madison Wingerter)
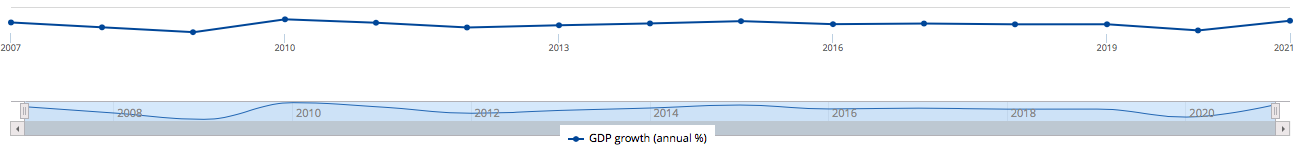
Figure 4a. This represents Sweden’s annual percentage of GDP growth within the last fifteen years (2007-2021).
| 2007 | 2008 | 2009 | 2010 | 2011 | 2012 | 2013 | 2014 | 2015 | 2016 | 2017 | 2018 | 2019 | 2020 | 2021 |
| 3.44 | -0.45 | -4.34 | 5.95 | 3.20 | -0.59 | 1.19 | 2.66 | 4.49 | 2.07 | 2.57 | 1.95 | 1.99 | -2.94 | 4.80 |
Inflation, Consumer Prices (Madison Wingerter)
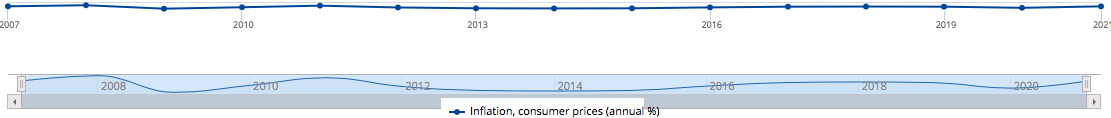
| Year | 2007 | 2008 | 2009 | 2010 | 2011 | 2012 | 2013 | 2014 | 2015 | 2016 | 2017 | 2018 | 2019 | 2020 | 2021 |
| Inflation, consumer prices (Annual %) | 2.21 | 3.44 | -0.49 | 1.16 | 2.96 | 0.89 | -0.04 | -0.18 | -0.05 | 0.98 | 1.79 | 1.95 | 1.78 | 0.50 | 2.16 |
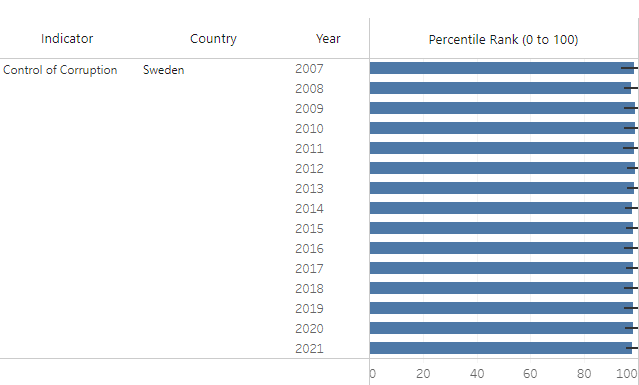
Control of Corruption – Krista DeModna
Definition: Control of corruption captures perceptions of the extent to which public power is exercised for private gain, including both petty and grand forms of corruption, as well as “capture” of the state by elites and private interests. This table lists the individual variables from each data source used to construct this measure in the Worldwide Governance Indicators.
| Year | Number of Sources | Governance (-2.5 to +2.5) | Percentile Rank | Standard Error |
| 2007 | 9 | 2.23 | 98.54 | 0.17 |
| 2008 | 9 | 2.21 | 97.57 | 0.16 |
| 2009 | 9 | 2.24 | 99.04 | 0.17 |
| 2010 | 9 | 2.22 | 99.05 | 0.16 |
| 2011 | 10 | 2.17 | 99.58 | 0.15 |
| 2012 | 10 | 2.28 | 99.05 | 0.14 |
| 2013 | 10 | 2.24 | 98.58 | 0.14 |
| 2014 | 10 | 2.11 | 97.60 | 013 |
| 2015 | 10 | 2.19 | 98.08 | 0.13 |
| 2016 | 11 | 2.15 | 98.08 | 0.14 |
| 2017 | 11 | 2.14 | 98.08 | 0.13 |
| 2018 | 11 | 2.15 | 98.08 | 0.14 |
| 2019 | 11 | 2.13 | 98.08 | 0.14 |
| 2020 | 10 | 2.13 | 98.08 | 0.15 |
| 2021 | 10 | 2.13 | 97.60 | 0.16 |

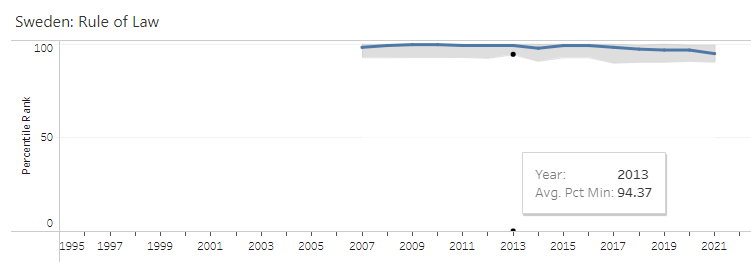
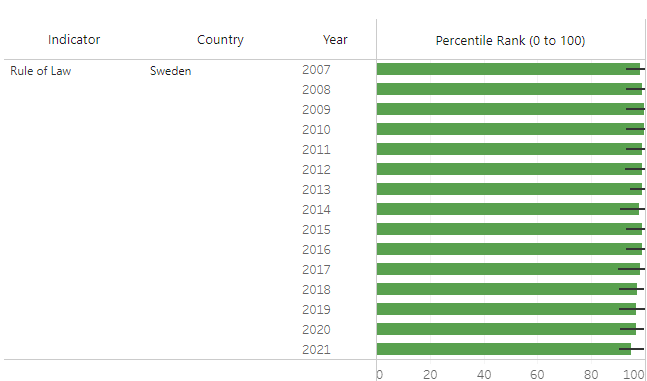
Rule of Law – Krista DeModna
Definition: Rule of law captures perceptions of the extent to which agents have confidence in and abide by the rules of society, and in particular the quality of contract enforcement, property rights, the police, and the courts, as well as the likelihood of crime and violence. This table lists the individual variables from each data source used to construct this measure in the Worldwide Governance Indicators.
| Year | Number of Sources | Governance (-2.5 to +2.5) | Percentile Rank | Standard Error |
| 2007 | 11 | 1.89 | 98.09 | 0.16 |
| 2008 | 11 | 1.92 | 99.04 | 0.16 |
| 2009 | 11 | 1.96 | 99.53 | 0.16 |
| 2010 | 12 | 1.93 | 99.53 | 0.15 |
| 2011 | 13 | 1.92 | 99.06 | 0.14 |
| 2012 | 13 | 1.93 | 99.06 | 0.15 |
| 2013 | 13 | 1.95 | 99.06 | 0.15 |
| 2014 | 12 | 1.98 | 97.60 | 0.16 |
| 2015 | 12 | 2.02 | 99.04 | 0.16 |
| 2016 | 11 | 1.98 | 99.04 | 0.17 |
| 2017 | 11 | 1.85 | 99.08 | 0.16 |
| 2018 | 11 | 1.82 | 97.12 | 0.15 |
| 2019 | 11 | 1.82 | 96.63 | 0.16 |
| 2020 | 10 | 1.80 | 96.63 | 0.15 |
| 2021 | 10 | 1.73 | 94.71 | 0.16 |
Terrorism – Clare McCurley
Incidents Over Time

Target Type
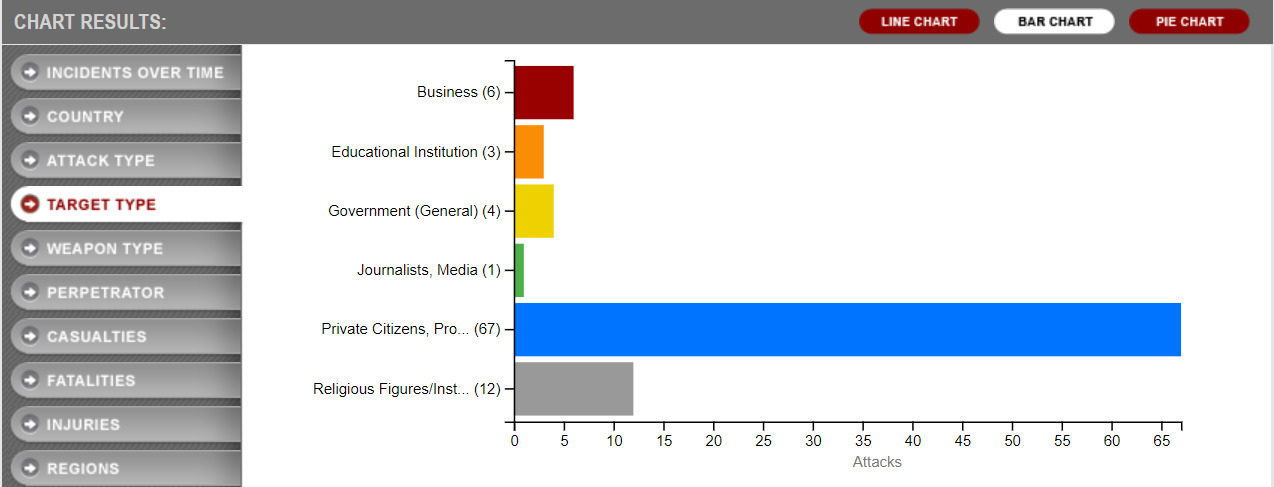
Figure 8b. Target types and places that are normally targeted during a terrorist attack. This data is from the past 15 years (2007-2021).
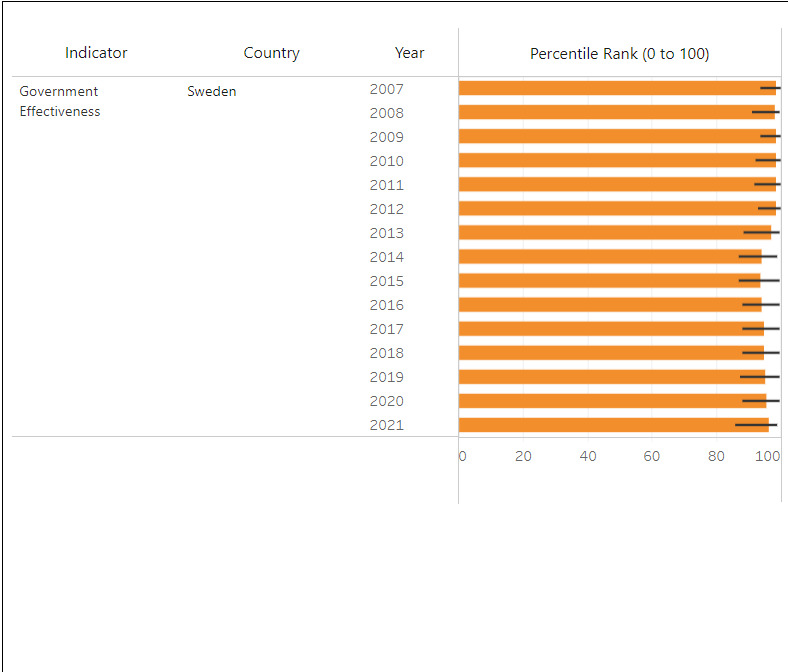
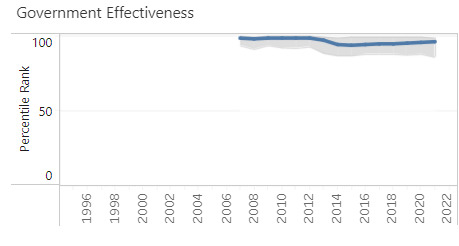
Government Effectiveness- Clare McCurley
Government effectiveness captures perceptions of the quality of public services, the quality of the civil service and the degree of its independence from political pressures, the quality of policy formulation and implementation, and the credibility of the government’s commitment to such policies.
| Country | Year | Number of Sources | Governance (-2.5 to +2.5) | Percentile Rank | Standard Error | |
| Government Effectiveness | Sweden | 2007 | 7 | 2.02 | 98.54 | 0.22 |
| 2008 | 7 | 1.95 | 98.06 | 0.23 | ||
| 2009 | 7 | 2.04 | 98.56 | 0.22 | ||
| 2010 | 8 | 1.96 | 98.56 | 0.22 | ||
| 2011 | 8 | 1.92 | 98.58 | 0.21 | ||
| 2012 | 8 | 1.91 | 98.58 | 0.21 | ||
| 2013 | 8 | 1.79 | 97.16 | 0.20 | ||
| 2014 | 8 | 1.68 | 94.23 | 0.21 | ||
| 2015 | 8 | 1.71 | 93.75 | 0.21 | ||
| 2016 | 8 | 1.69 | 94.23 | 0.21 | ||
| 2017 | 8 | 1.71 | 94.71 | 0.21 | ||
| 2018 | 8 | 1.70 | 94.71 | 0.21 | ||
| 2019 | 8 | 1.70 | 95.19 | 0.22 | ||
| 2020 | 7 | 1.71 | 95.67 | 0.23 | ||