Introduction – Logan P.
Brazil is the largest and most populated country in South America with a total of 217,240,060 citizens; it is ranked as the 7th largest populated country in the world. The majority live on the Atlantic Coast in the east and most of the population is urbanized. Two of the most large-scale cities are Sao Paulo (home to 22.430 million people) and Rio de Janeiro (home to 13.634 million people).
The dominant language spoken by Brazilians is Portuguese, which is unique to this particular South American country. Considering the fact that Brazil is a large and diverse country, languages of Spanish, English, and German are also commonly used.
Brazil is home to the second largest river in the World, the Amazon River. It is also home to 60% of the World’s rainforest. Due to Brazil’s vast biosphere, it is often referred to as “The Lungs of the Earth” as it combats the effects of climate change.
Rio De Janeiro was at one point the capital of the Portuguese Empire when Napoleon was invading the Iberian Peninsula. This took place from 1815 until 1820.
Extent of Globalization
1. Trade – Mason Staz
This section demonstrates the trade of Brazil, which is taken as a percentage of GDP (gross domestic product). There are patterns that can be seen in the table below, as there is an increase in trade for a few years at a time and then during some years, there is a decrease.
| Country Name | 2002 | 2003 | 2004 | 2005 | 2006 | 2007 | 2008 | 2009 | 2010 | 2011 | 2012 | 2013 | 2014 | 2015 | 2016 | 2017 | 2018 | 2019 | 2020 | 2021 |
|---|---|---|---|---|---|---|---|---|---|---|---|---|---|---|---|---|---|---|---|---|
| Brazil | 27.6 | 28.1 | 29.7 | 27.1 | 26.0 | 25.3 | 27.3 | 22.1 | 22.8 | 23.9 | 25.1 | 25.8 | 24.7 | 26.9 | 24.5 | 24.3 | 28.9 | 28.9 | 32.9 | 39.2 |
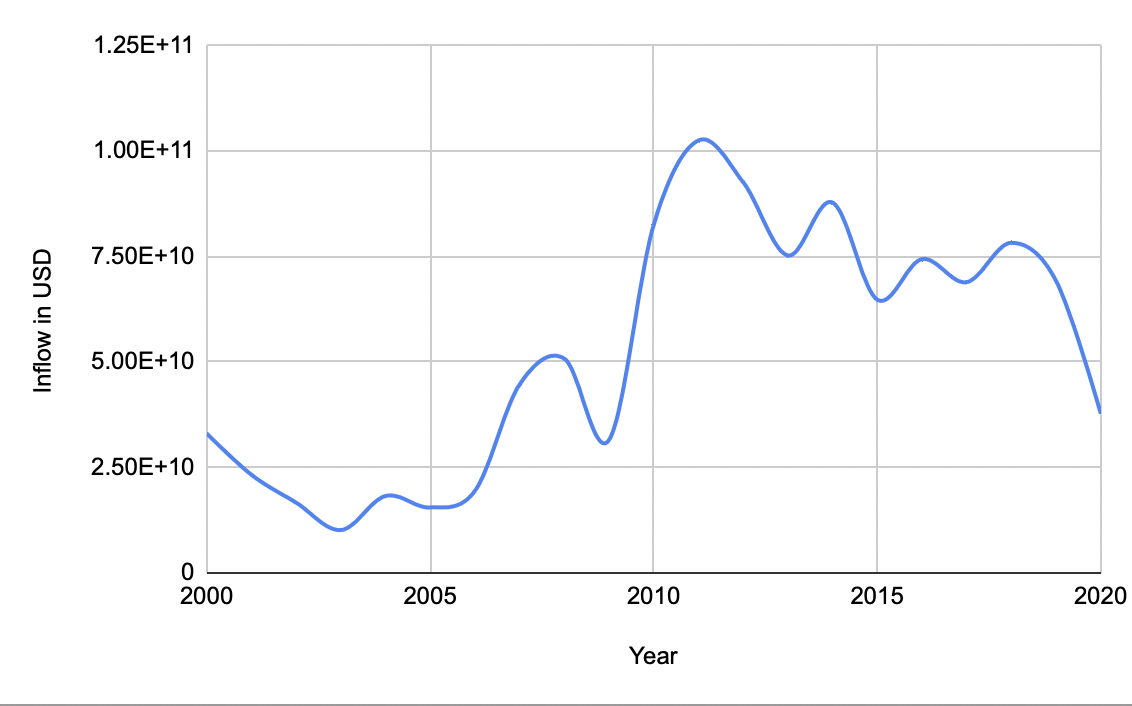
2. Foreign Direct Investment Inflows
Silvia Zarama
The inflows in Brazil began to grow around 2006 and stayed in the higher middle range until 2019, when it fell again.
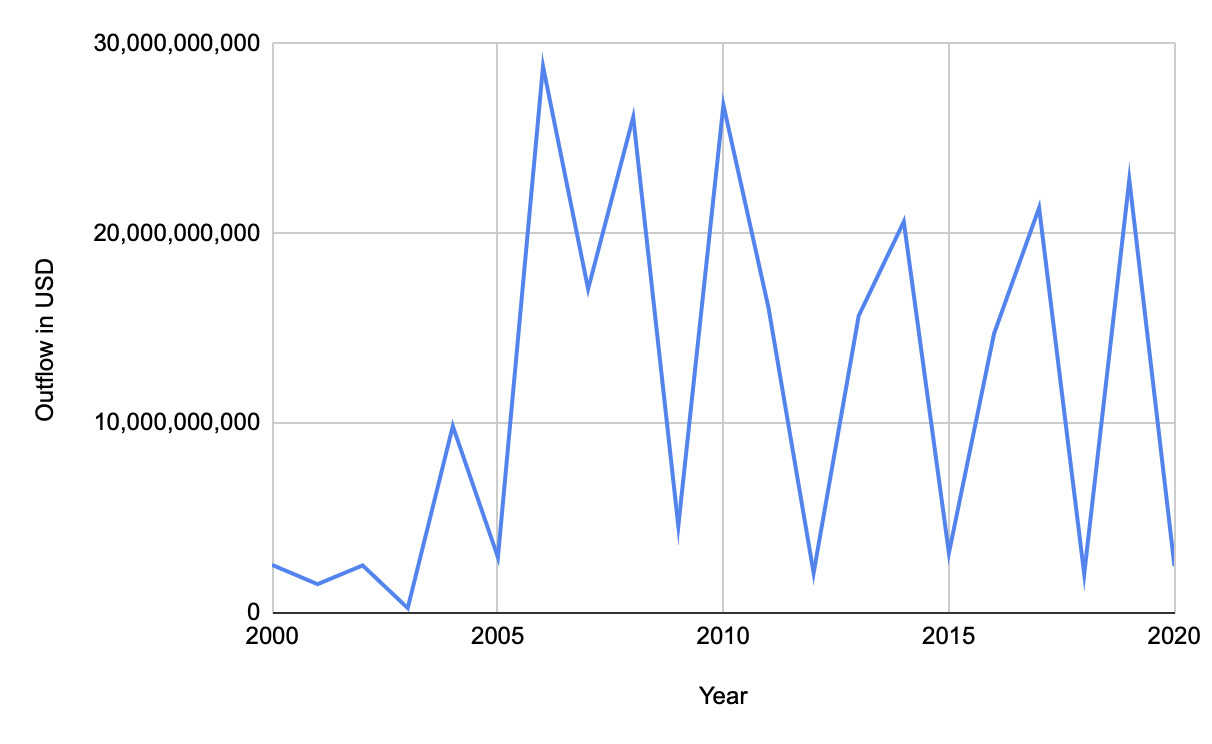
3. Foreign Direct Investment Outflows
Silvia Zarama
In the last two decades, Brazil’s FDI outflows have been very inconsistent. The maximum outflow per year occurred in 2006 at over 28 billion USD. The minimum was approximately 228 million in 2003. The outflow began to grow drastically in 2005, from the previous maximum of 10 billion USD to nearly 29 billion.
Add Tables & Graphs
4. Attitudes Toward Globalization – Matt
In general, the people of Brazil are in favor of globalization through trade as they feel that it will make their economy better.
| Questions | Country | Time | Increase | Decrease | Does Not Make a Difference | D/K Refused | Total |
| Does trade with other countries lead to an increase in the wages of (survey nationality) workers, a decrease in wages, or does it not make a difference? | Brazil | Spring 2014 | 44 | 16 | 35 | 6 | 100 |
| Does trade with other countries lead to job creation in (survey country), job losses, or does it not make a difference? | Brazil | Spring 2014 | 56 | 15 | 25 | 4 | 100 |
| Does trade with other countries lead to an increase in the price of products sold in (survey country), a decrease in prices, or does it not make a difference? | Brazil | Spring 2014 | 55 | 16 | 25 | 4 | 100 |
5. Internet Access – Logan P.
The rates of internet access in Brazil have increased gradually and data support the prediction that access and users will continue to grow. The rapid level of increasing internet users in the year 2020 is assumed to be caused by the increase in internet during the Covid-19 pandemic. World Development Indicators of the World Bank DataBank show that Brazil is reliant on internet access which proves internet services to be highly relevant in this country. Data can be traced back to 1992, when the top 0.01% of the population used internet services. By 2012, nearly half of Brazil used the internet. By 2020, the percentage of users grew to 81.34%

| Country Name | Series Name | 2012 | 2013 | 2014 | 2015 | 2016 | 2017 | 2018 | 2019 | 2020 |
| Brazil | Individuals using the Internet (% of population) | 48.56 | 51.04 | 54.55 | 58.33 | 60.87 | 67.47 | 70.43 | 73.91 | 81.34 |
| Brazil | Secure Internet servers | 14059 | 17456 | 22778 | 32503 | 84536 | 328718 | 426560 | 578468 | 656211 |

6. Participation in International Agreements – Matt
Brazil is a member of AfDB (nonregional member), BIS, BRICS, CAN (associate), CD, CELAC, CPLP, FAO, FATF, G-15, G-20, G-24, G-5, G-77, IADB, IAEA, IBRD, ICAO, ICC (national committees), ICCt, ICRM, IDA, IFAD, IFC, IFRCS, IHO, ILO, IMF, IMO, IMSO, Interpol, IOC, IOM, IPU, ISO, ITSO, ITU, ITUC (NGOs), LAES, LAIA, LAS (observer), Mercosur, MIGA, MINURSO, MINUSTAH, MONUSCO, NAM (observer), NSG, OAS, OECD (enhanced engagement), OPANAL, OPCW, Paris Club (associate), PCA, SICA (observer), UN, UNASUR, UNCTAD, UNESCO, UNFICYP, UNHCR, UNIDO, UNIFIL, Union Latina, UNISFA, UNITAR, UNMIL, UNMISS, UNOCI, UNRWA, UNWTO, UPU, WCO, WFTU (NGOs), WHO, WIPO, WMO, WTO
7. Tourism – Logan P.
The tourism indicator includes information on the total number of arrivals and departures of tourists in Brazil as well as payments to international carriers for transportation into and from Brazil. Receipts and expenditures are calculated based on the percentage of total exports and imports to Brazil. Receipts and expenditures are also analyzed through costs of passenger transport and travel items. The World Data Bank provides a transformation of total imports and exports from Brazilian currency to U.S. dollars for comparison. The immense diversity of Brazil contributes to it’s high tourism rates. Data can be traced back to 1995 and extends to 2020 using the World Development Indicators available through the World Bank’s DataBank.

Arrivals
Most recent data from 2019 shows that 6,353,000 people arrived to Brazil throughout the year. The number of arrivials the year before was 6,621,000 which is the highest reported number of arrivals in Brazil’s history. The decrease in tourism rates in the following years may be caused by pandemic restrictions. Despite recent years, tourism drastically increased in Brazil throughout the past ten years.
Departures
Most recent data from 2018 shows 10,628,000 departures from Brazil. This number increased from the year before in which there were 10,610,000 departures. This is evidence that rates of departure are increasing at a higher rate than the number of arrivals. The most significant increase can be seen between 2015 and 2018 (9,478,000 departures to 10,628,000).

Receipts (% of total exports)
The total percentage of receipts of exports gradually increased in Braziil up until 2016 in which there was a decrease from 3.04% (2016) to 2.45% (2017) to 2.30% (2018). This trend seems to be continuing as 2020 had the lowest reported percentage of exports which was calculated as 1.30%.
Expenditures (% of total imports)
The rates of imports in Brazil are much higher than the rates of exports. In 2012, 8.55% of imports were recorded which increased to 8.99% in 2013 and then again to 9.41% in 2014. Rates began decreasing in 2015 (8.37%), but increased to the highest reported percentage of imports in 2017 (9.85%). A decrease occured again in 2018, and by 2020, the lowest percentage of imports was reported at 2.85%. Nonetheless, this percentage remains higher than percentage of total receipts.

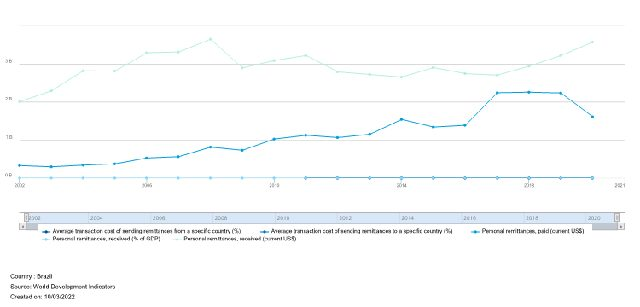
8. Immigration & Emigration Remittances – Mason Staz
This section describes how much money it cost for immigration and emigration remittances. This is the amount of money that migrants send back to families who still live in the country.
| Country Name | Series Name | 2012 | 2013 | 2014 | 2015 | 2016 | 2017 | 2018 | 2019 | 2020 | 2021 |
|---|---|---|---|---|---|---|---|---|---|---|---|
| Brazil | Average transaction cost of sending remittances from a specific country (%) | 5.9 | 5.9 | 5.3 | 7.4 | 5.7 | 4.6 | 6.5 | 6.6 | 9.8 | .. |
| Brazil | Average transaction cost of sending remittances to a specific country (%) | 12.9 | 11.9 | 7.7 | 7.0 | 6.8 | 6.3 | 7.1 | 7.6 | 6.9 | .. |
| Brazil | Personal remittances, paid (current US$) | 1.06E+09 | 1.15E+09 | 1.54E+09 | 1.34E+09 | 1.39E+09 | 2.24E+09 | 2.25E+09 | 2.23E+09 | 1.61E+09 | .. |
| Brazil | Personal remittances, received (% of GDP) | 0.1 | 0.1 | 0.1 | 0.2 | 0.2 | 0.1 | 0.2 | 0.2 | 0.2 | .. |
| Brazil | Personal remittances, received (current US$) | 2.78E+09 | 2.72E+09 | 2.65E+09 | 2.9E+09 | 2.74E+09 | 2.7E+09 | 2.93E+09 | 3.21E+09 | 3.57E+09 | .. |
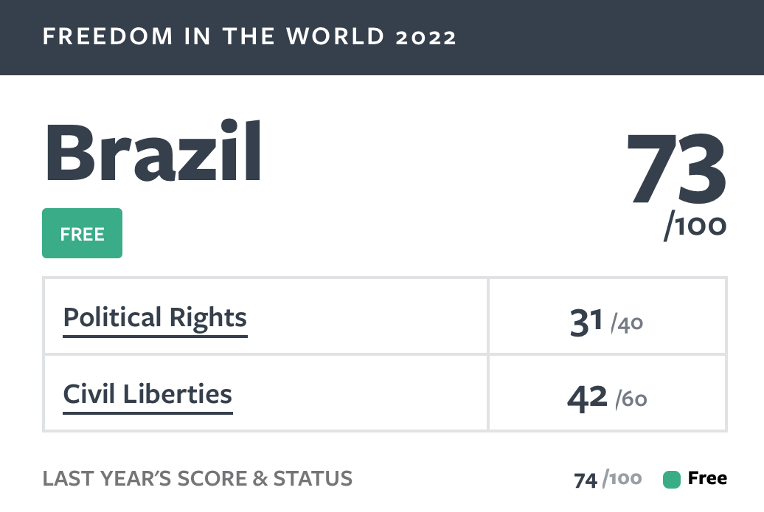
9. Freedom – Logan Pasley
As seen in Figure 1, Brazil’s total global score is 73/100 and the country status is free for the most recent year, 2022. In 2021, Brazil’s total global score was 74/100. As of 2022, Brazil’s political rights score is 31/40 and its Civil Liberties score is 42/60. (https://freedomhouse.org/countries/freedom-world/scores )
Political Rights Score
In terms of political rights, this country does particularly well on maintaining relatively free and fair legislative elections as election laws are generally well enforced; this country does particularly poorly on controlling high-level corruption scandals, pre-election threats, violent crimes towards candidates, and exclusion of minority voters.
Civil Liberties Score
In terms of civil liberties, this country does particularly well on ensuring freedom of expression, religious belief, and public expression without concern of surveillance; this country does particularly poorly on controlling harassment, discrimination, threats, spread of false information, corruption, and violence.
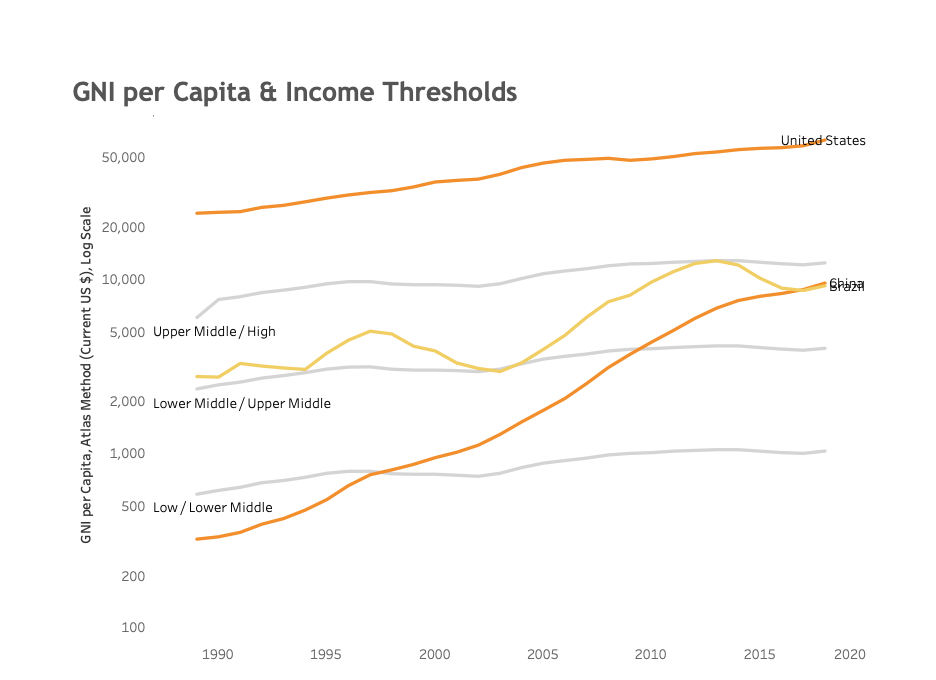
10. Income Category – Logan Pasley
As seen in Figure 2, Brazil falls into the upper-middle/ high-income category as of 2020. There was a decrease in Brazil’s total income within the last year. In 1990, Brazil was in the lower-middle/ upper-middle income category. (https://datatopics.worldbank.org/world-development-indicators/stories/the-classification-of-countries-by-income.html )
Indicator of Brazil’s Level of Development (https://databank.worldbank.org/source/world-development-indicators ):
| Year | GNI per Capita (constant 2015 US$) |
| 2007 | 7772.362 |
| 2008 | 8055.146 |
| 2009 | 7997.467 |
| 2010 | 8422.304 |
| 2011 | 8721.425 |
| 2012 | 8817.987 |
| 2013 | 9104.061 |
| 2014 | 9027.194 |
| 2015 | 8628.462 |
| 2016 | 8260.089 |
| 2017 | 8319.622 |
| 2018 | 8318.923 |
| 2019 | 8359.642 |
| 2020 | 8011.664 |
| 2021 | 8280.35 |
11. Market Indicators – Mason Staz
| Year | GDP per capita (constant 2015 US$) |
| 2010 | 8702.3 |
| 2011 | 8965.6 |
| 2012 | 9056.6 |
| 2013 | 9247.6 |
| 2014 | 9215.0 |
| 2015 | 8814.0 |
| 2016 | 8455.3 |
| 2017 | 8498.3 |
| 2018 | 8582.3 |
| 2019 | 8622.1 |
| 2020 | 8228.8 |
| 2021 | 8551.2 |

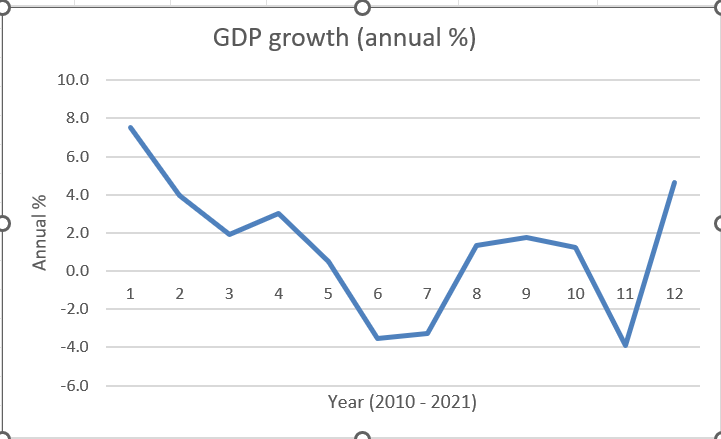
| Year | GDP growth (annual %) |
| 2010 | 7.5 |
| 2011 | 4.0 |
| 2012 | 1.9 |
| 2013 | 3.0 |
| 2014 | 0.5 |
| 2015 | -3.5 |
| 2016 | -3.3 |
| 2017 | 1.3 |
| 2018 | 1.8 |
| 2019 | 1.2 |
| 2020 | -3.9 |
| 2021 | 4.6 |
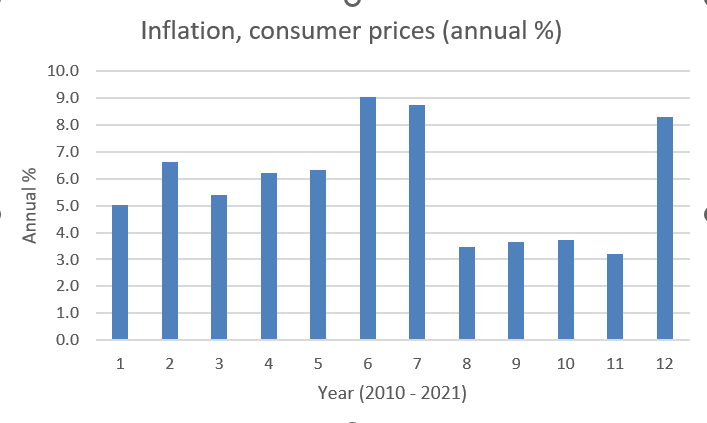
| Year | Inflation, Consumer Prices (annual %) |
| 2010 | 5.0 |
| 2011 | 6.6 |
| 2012 | 5.4 |
| 2013 | 6.2 |
| 2014 | 6.3 |
| 2015 | 9.0 |
| 2016 | 8.7 |
| 2017 | 3.4 |
| 2018 | 3.7 |
| 2019 | 3.7 |
| 2020 | 3.2 |
| 2021 | 8.3 |
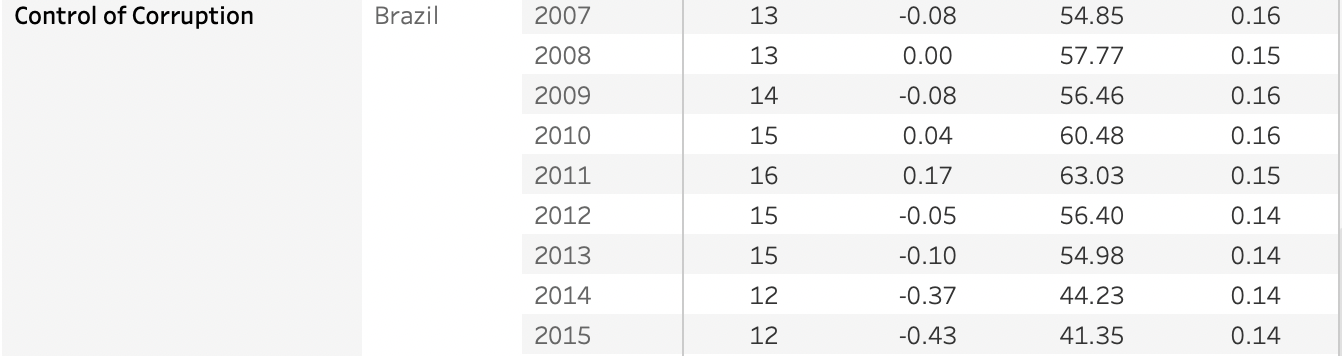
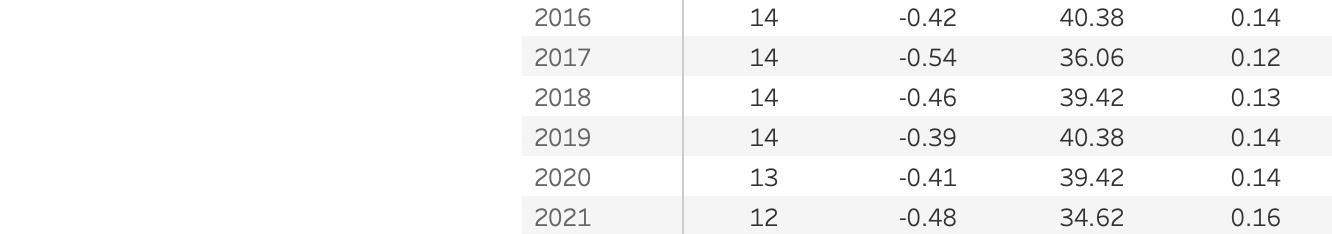
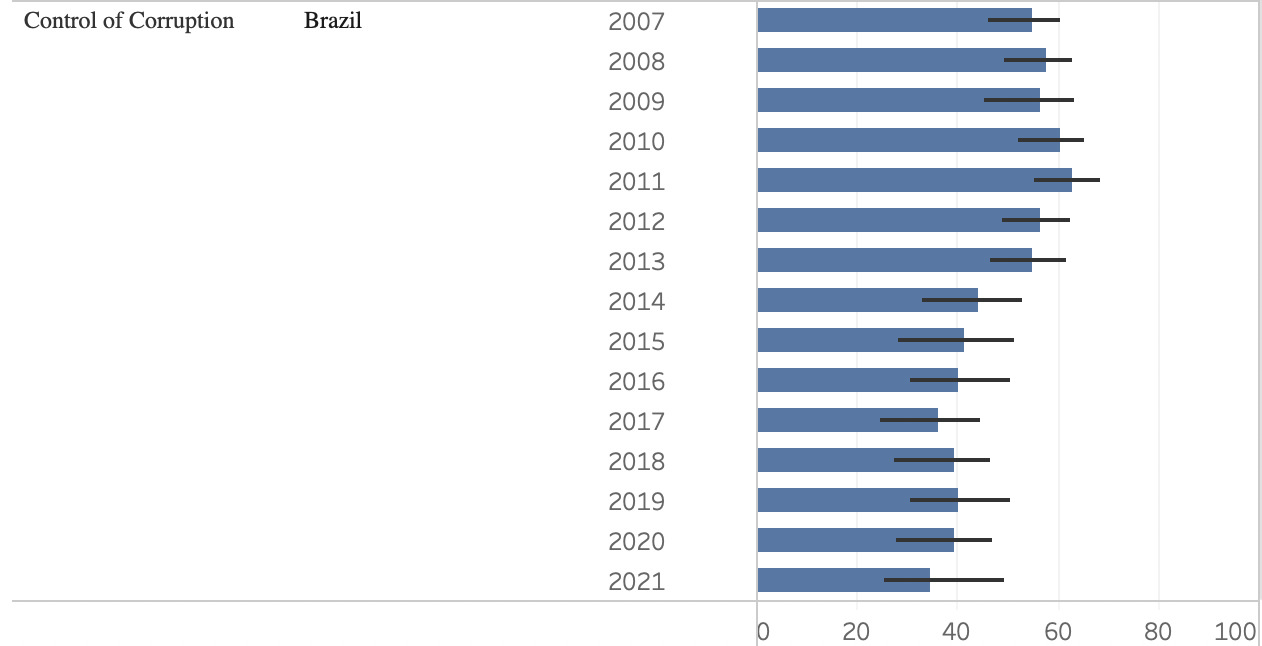
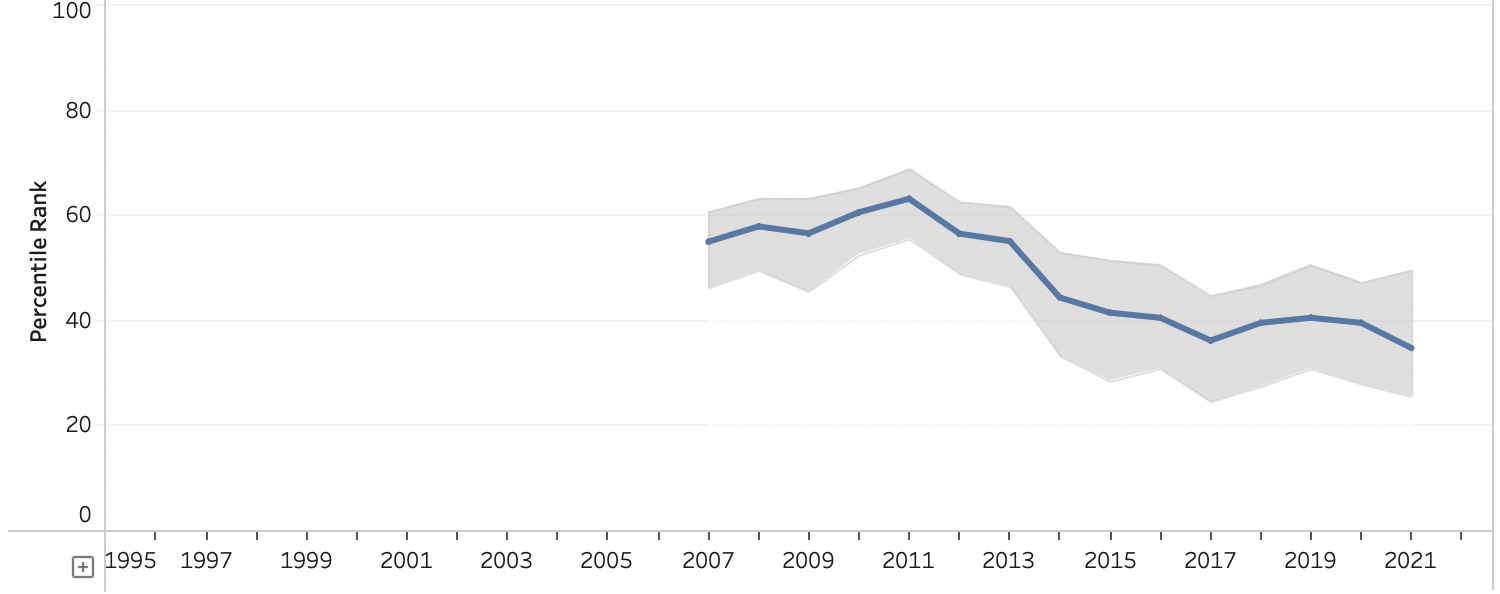
12. Control Of Corruption – Silvia Zarama
Control of corruption refers to how often public power is used for personal or private gain.
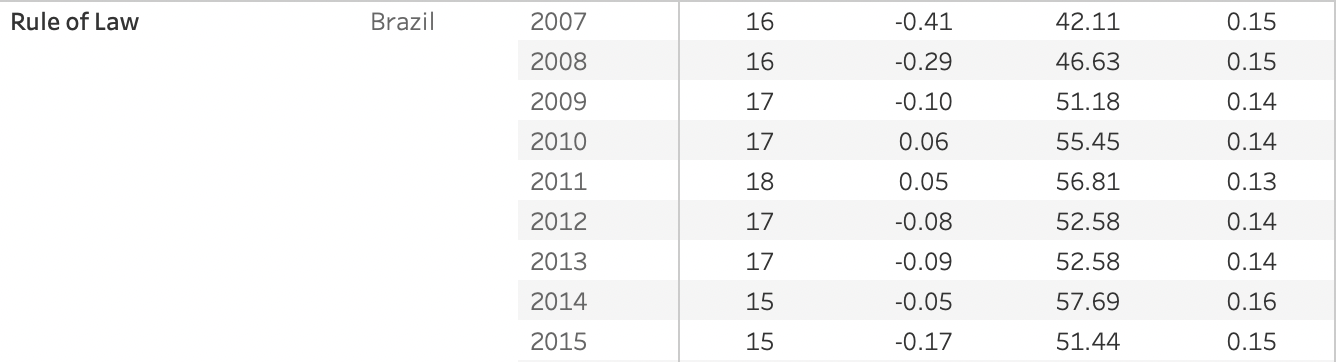
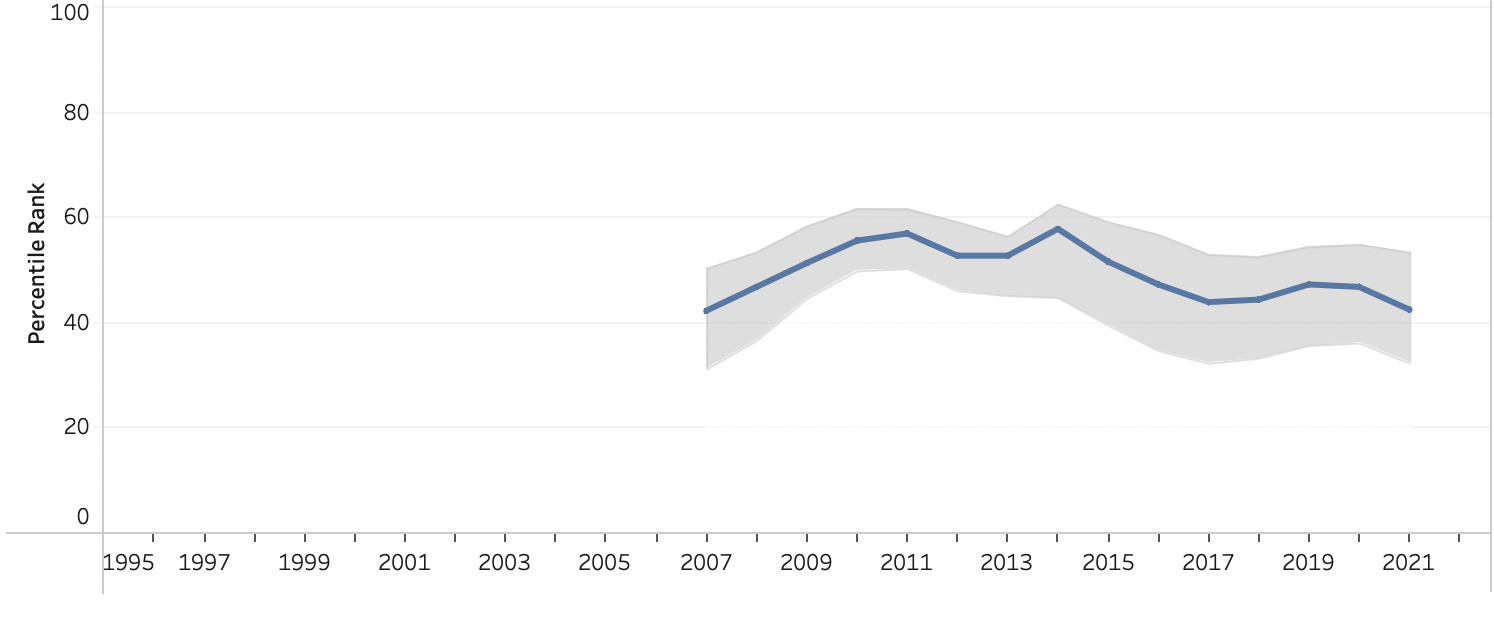
13. Rule Of Law – Silvia Zarama
Rule of law sets limits to the power that a government has over its people.